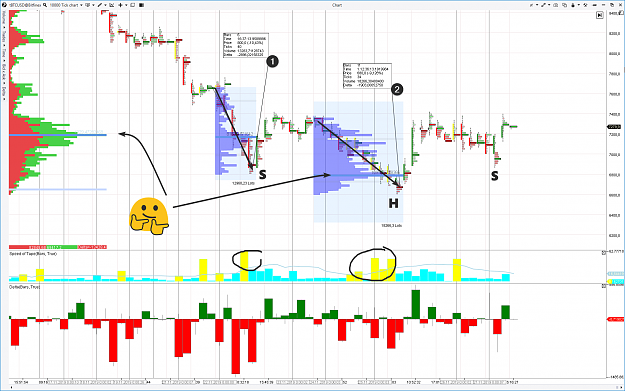
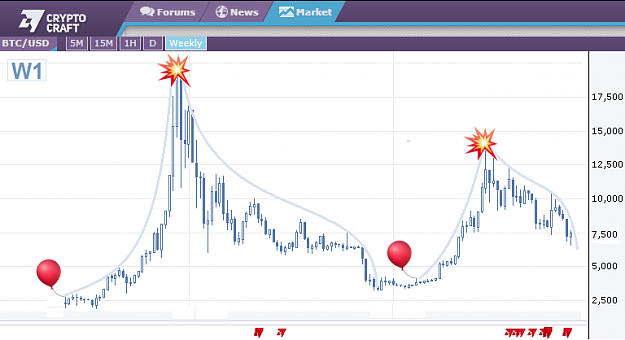
• Home
  • Forums
  • News
  • Calendar
  • Coins
  • Market
  • Login
  • Join
  • User/Email: Password:
  • 10:33pm
Menu
  • Forums
  • News
  • Calendar
  • Coins
  • Market
  • Login
  • Join
  • 10:33pm
Sister Sites
  • Metals Mine
  • Energy EXCH
  • Forex Factory

Options

Bookmark Thread

First Page First Unread Last Page Last Post

Print Thread

Similar Threads

Bitcoin (BTCUSD) 197 replies

The fall of BTCUSD -cash it 77 replies

BTCUSD Strictly Pivot levels 168 replies

  • Interactive Trading
  • /
  • Reply to Thread
  • Subscribe
  • 297
Attachments: BTCUSD daily price action
Exit Attachments

BTCUSD daily price action

  • Last Post
  •  
  • 1 3637Page 383940 43
  • 1 37Page 3839 43
  •  
  • Post #741
  • Quote
  • Nov 26, 2019 4:24pm Nov 26, 2019 4:24pm
  •  Lekkim
  • Joined Apr 2019 | Status: Trading fanatic back in action | 885 Posts
Quoting detector
Disliked
Hello all, still got my on bit coin, still waiting for the gap to fill, I have this in an uptrend but a scenario could be a spike to complete the jigsaw, I asked about confirming the gap, no one came forward, while there are some good chartists, no one taking up the batton, so will ask again, is it my data or is there a gap at the bottom of the recent rise, thanks, D
Ignored
I believe 8k will be reached before the weekend,
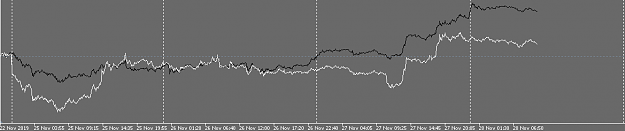
still a huge gap between client-volume and price
 
2
  • Post #742
  • Quote
  • Nov 26, 2019 5:02pm Nov 26, 2019 5:02pm
  •  cryptocow
  • Joined Aug 2018 | Status: Mooing | 1,039 Posts
Quoting detector
Disliked
Hello all, still got my on bit coin, still waiting for the gap to fill, I have this in an uptrend but a scenario could be a spike to complete the jigsaw, I asked about confirming the gap, no one came forward, while there are some good chartists, no one taking up the batton, so will ask again, is it my data or is there a gap at the bottom of the recent rise, thanks, D
Ignored
What data feed are you looking at?
 
1
  • Post #743
  • Quote
  • Nov 26, 2019 5:13pm Nov 26, 2019 5:13pm
  •  detector
  • Joined Dec 2017 | Status: Member | 3,654 Posts
Quoting cryptocow
Disliked
{quote} What data feed are you looking at?
Ignored
CC, it's ETX, data on mt4, seems accurate enough with little or no holes in it, 78 bars back on the 30 min the price gapped, there was a wick down but it needs to be the body of the candle not the high/low, if you can clarify that would be great, D
I don't need to be good at the game, only good enough to beat my opponent,
 
 
  • Post #744
  • Quote
  • Nov 26, 2019 5:43pm Nov 26, 2019 5:43pm
  •  Hasher
  • Joined Jul 2019 | Status: Member | 316 Posts
Quoting detector
Disliked
{quote} CC, it's ETX, data on mt4, seems accurate enough with little or no holes in it, 78 bars back on the 30 min the price gapped, there was a wick down but it needs to be the body of the candle not the high/low, if you can clarify that would be great, D
Ignored
Crypto Craft? Says they get data from the exchanges like Coinbase: https://www.cryptocraft.com/userguide.php#market
 
1
  • Post #745
  • Quote
  • Nov 26, 2019 6:00pm Nov 26, 2019 6:00pm
  •  detector
  • Joined Dec 2017 | Status: Member | 3,654 Posts
Quoting Hasher
Disliked
{quote} Crypto Craft? Says they get data from the exchanges like Coinbase: https://www.cryptocraft.com/userguide.php#market
Ignored
H, according to the charts on the FF interface there is no gap, mmm, cheers D
I don't need to be good at the game, only good enough to beat my opponent,
 
1
  • Post #746
  • Quote
  • Nov 26, 2019 7:26pm Nov 26, 2019 7:26pm
  •  Hasher
  • Joined Jul 2019 | Status: Member | 316 Posts
Quoting detector
Disliked
{quote} H, according to the charts on the FF interface there is no gap, mmm, cheers D
Ignored
Makes sense, the crypto exchanges run 24/7 so there should be no gaps beyond typical price execution. MT4 brokers are probably closing each week when the FX market does.
 
2
  • Post #747
  • Quote
  • Nov 27, 2019 5:01am Nov 27, 2019 5:01am
  •  TudorIoan
  • Joined Dec 2015 | Status: Member | 13,929 Posts
BTCUSD daily price action
I see a 30+ days bleeding on D1
...where's the bottom this time ??? 5000 ???
Attached Image
Member
 
1
  • Post #748
  • Quote
  • Edited at 7:10am Nov 27, 2019 5:05am | Edited at 7:10am
  •  TMR
  • Joined Jan 2007 | Status: OG | 581 Posts
Short-term technical indicators continue to report bearish conditions. Notably, the 5- and 10-day averages continue to trend south and will likely cap corrective rallies.

Bitcoin needs to break above resistance near $7,400 to confirm a short-term bull reversal.

Major support level currently at $6,500.
Attached Image (click to enlarge)
Click to Enlarge

Name: Capture.PNG
Size: 67 KB
Money isn't real
 
1
  • Post #749
  • Quote
  • Nov 27, 2019 5:10am Nov 27, 2019 5:10am
  •  TudorIoan
  • Joined Dec 2015 | Status: Member | 13,929 Posts
Quoting TMR
Disliked
Short-term technical indicators continue to report bearish conditions. Notably, the 5- and 10-day averages continue to trend south and will likely cap corrective rallies. Major support level currently at $6,500 {image}
Ignored
Oh, great professional view! Very useful. Edifying. Thanks
Member
 
 
  • Post #750
  • Quote
  • Nov 27, 2019 7:21am Nov 27, 2019 7:21am
  •  Lekkim
  • Joined Apr 2019 | Status: Trading fanatic back in action | 885 Posts
CRAB-17 STAGE II, is it over?
8k before week close was bold, however not impossible, hehe
Inserted Video
 
1
  • Post #751
  • Quote
  • Nov 27, 2019 10:38am Nov 27, 2019 10:38am
  •  olegchartist
  • Joined Sep 2019 | Status: Member | 230 Posts
What is important in the recent BTCUSD Head-and-Shoulders pattern

Attached Image (click to enlarge)
Click to Enlarge

Name: O8LkPxt1.png
Size: 56 KB


Many traders noted reversed SHS pattern on the BTCUSD market. But what is important. Study the price/volume on downwaves 1 and 2.

1st down-wave has
40 ticks progress
13k volume

2nd down-wave has
34 ticks progress
18k volume

Suppose the volume is effort and price progress is the result of effort. Then you can suggest the bears got smaller results amid bigger effort. This is a sign of hidden strength. Yellow bars show a period of fast trading activity. This is a sign of professional whales were present at 7.2 and 6.8. What did they do? If they turned from bearish to bullish then this zone 6800 and 7200 is becoming a zone of strength.

Follow My Thread
Oleg Alexandrov, market analyst. Find me in Google
 
1
  • Post #752
  • Quote
  • Nov 27, 2019 12:29pm Nov 27, 2019 12:29pm
  •  TMR
  • Joined Jan 2007 | Status: OG | 581 Posts
BTC: Price: $7,250 | Market cap: $131 Billion | 24-Hr Volume: $19 Billion

Short-trend: Neutral

BTC has risen from $6,900 to $7,250 in the last few hours despite the theft at the leading South Korean exchange Upbit, validating the seller exhaustion signaled by key technical indicators earlier this week.

The three-day chart is now reporting a hammer candle, a warning of an impending bull reversal. Traders usually wait for confirmation in the form of strong follow-through, preferably a convincing move above the high of the hammer candle.

That means a break above $7,380 is needed to confirm a bullish reversal and possibly lead to a stronger recovery rally to $8,000.

Note that a move above $7,380 will also activate twin bullish cues on the 4-hour chart: an upside break of the descending trendline and an inverse head-and-shoulders breakout on the line chart.

Long-term trend: Neutral
Attached Image (click to enlarge)
Click to Enlarge

Name: unnamed (1).png
Size: 65 KB
Money isn't real
 
5
  • Post #753
  • Quote
  • Nov 27, 2019 3:40pm Nov 27, 2019 3:40pm
  •  vanillaice
  • | Joined Jul 2019 | Status: Member | 217 Posts
Quoting TMR
Disliked
That means a break above $7,380 is needed to confirm a bullish reversal and possibly lead to a stronger recovery rally to $8,000. Note that a move above $7,380 will also activate twin bullish cues on the 4-hour chart: an upside break of the descending trendline and an inverse head-and-shoulders breakout on the line chart. Long-term trend: Neutral {image}
Ignored
A few hours later, it is still on the up and up. I think we will see some solid resistance at 8k even if we get there. I think we're bound to bounce between 7-8k right now.
 
1
  • Post #754
  • Quote
  • Nov 28, 2019 3:31am Nov 28, 2019 3:31am
  •  TudorIoan
  • Joined Dec 2015 | Status: Member | 13,929 Posts
Hokey-pokey, I seee 10K ...in two days
Member
 
1
  • Post #755
  • Quote
  • Nov 28, 2019 3:40am Nov 28, 2019 3:40am
  •  Lekkim
  • Joined Apr 2019 | Status: Trading fanatic back in action | 885 Posts
BTC volume/price situation this week, surge incoming?
Attached Image (click to enlarge)
Click to Enlarge

Name: btcthisweek.PNG
Size: 12 KB
 
 
  • Post #756
  • Quote
  • Nov 28, 2019 10:34am Nov 28, 2019 10:34am
  •  Lekkim
  • Joined Apr 2019 | Status: Trading fanatic back in action | 885 Posts
Inserted Video
 
1
  • Post #757
  • Quote
  • Nov 28, 2019 2:59pm Nov 28, 2019 2:59pm
  •  TMR
  • Joined Jan 2007 | Status: OG | 581 Posts
BTC: Price: $7,470 | Market cap: $136 Billion | 24-Hr Volume: $21 Billion

Trend: Bullish

BTC gained 5 percent on Wednesday to print the biggest single-day gain in four weeks.

The convincing move above $7,400 activated twin bullish cues on the 4-hour chart: an upside break of a descending trendline and an inverse head-and-shoulder breakout. This has opened the doors for $8,200.

An potential bullish cross of the 50- and 200-hour moving averages also indicates the path of least resistance is to the higher side.

BTC looks set to test resistance at $7,800 in the next 48 hours or so. A violation there would expose $8,200. The short-term bullish case would weaken if prices fall below Wednesday’s low of $6,848 on high volumes.

Long-term trend: Neutral
Attached Image (click to enlarge)
Click to Enlarge

Name: unnamed (2).png
Size: 101 KB
Money isn't real
 
3
  • Post #758
  • Quote
  • Nov 28, 2019 6:23pm Nov 28, 2019 6:23pm
  •  detector
  • Joined Dec 2017 | Status: Member | 3,654 Posts
Quoting TMR
Disliked
BTC: Price: $7,470 | Market cap: $136 Billion | 24-Hr Volume: $21 Billion Trend: Bullish BTC gained 5 percent on Wednesday to print the biggest single-day gain in four weeks. The convincing move above $7,400 activated twin bullish cues on the 4-hour chart: an upside break of a descending trendline and an inverse head-and-shoulder breakout. This has opened the doors for $8,200. An potential bullish cross of the 50- and 200-hour moving averages also indicates the path of least resistance is to the higher side. BTC looks set to test resistance at $7,800...
Ignored
Could be selfish and hope the price will come back down but no, you all deserve this for your patients, think I've missed the bit boat, as I have said, no regrets and good luck all who sail, hope the wind carries you far and wideD
I don't need to be good at the game, only good enough to beat my opponent,
 
3
  • Post #759
  • Quote
  • Nov 29, 2019 1:54am Nov 29, 2019 1:54am
  •  TudorIoan
  • Joined Dec 2015 | Status: Member | 13,929 Posts
Please, allow my W1 view. I don't troll. I have "views" (fluttering eyelashes)
Oh, I thought I see a W1 pattern here! Oh... uh, ...is that right?!? Oh... I really think... I've seen this some time ago...oh!
The history seem to repeat itself for this magnificent asset! ...if you have honest eyes...
Just sayin', no trolling intended.
Attached Image (click to enlarge)
Click to Enlarge

Name: ZHART.png
Size: 37 KB
Member
 
 
  • Post #760
  • Quote
  • Nov 29, 2019 3:12am Nov 29, 2019 3:12am
  •  TMR
  • Joined Jan 2007 | Status: OG | 581 Posts
Please post in different thread Tudor. I asked you respectful via PM already.
Money isn't real
 
 
  • Interactive Trading
  • /
  • BTCUSD daily price action
  • Reply to Thread
    • 1 3637Page 383940 43
    • 1 37Page 3839 43
0 traders viewing now
  • More
Top of Page
  • Facebook
  • Twitter
About CC
  • Mission
  • Products
  • User Guide
  • Blog
  • Contact
CC Products
  • Forums
  • Calendar
  • News
  • Coins
  • Market
CC Website
  • Homepage
  • Search
  • Members
  • Report a Bug
Follow CC
  • Facebook
  • Twitter

CC Sister Sites:

  • Metals Mine
  • Energy EXCH
  • Forex Factory

Crypto Craft® is a brand of Fair Economy, Inc.

Terms of Service / ©2022