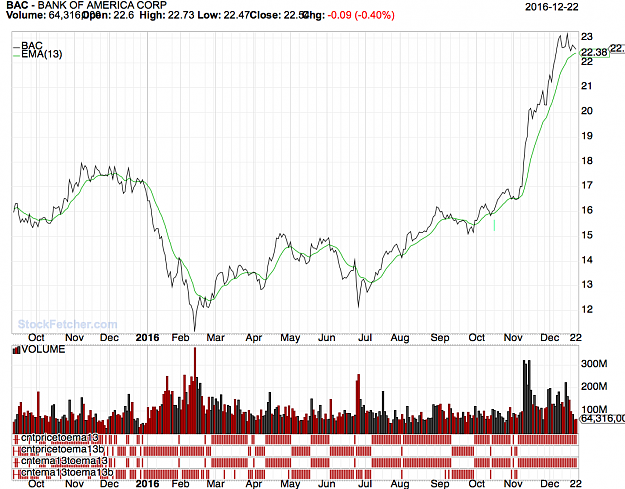
Daily chart . It can be a simple as price and one moving average The ema(13) . Price is above or below the ema(13). Trending rules apply as in a range or flat trend that goes side ways. I played with ema(13) for awhile also the ema(9). Price will pull the ema one way or the other. When price makes a cross above or below. The question is where does price point to. Does it point the the 12:00 to 2:00 position. See chart using lines instead of candles on BAC every time a price is above or new leg up on the ema(13). Sometimes it is a simple as seeing the tree's that are in the forrest.
Attached Image (click to enlarge)