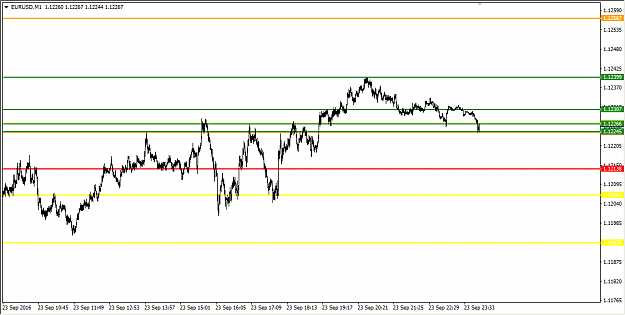
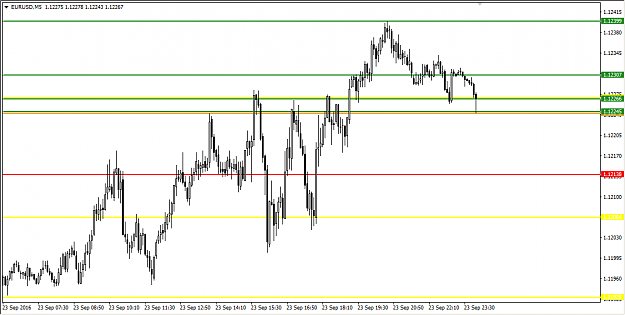
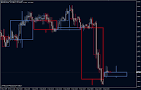
Hi, so the idea is - you can literally see all higher time frames from m1 and with more accuracy if you just zoom out enough....
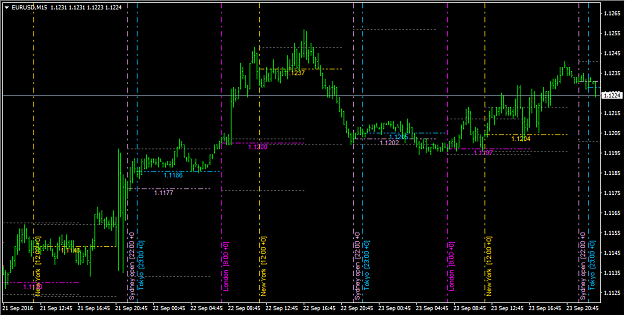
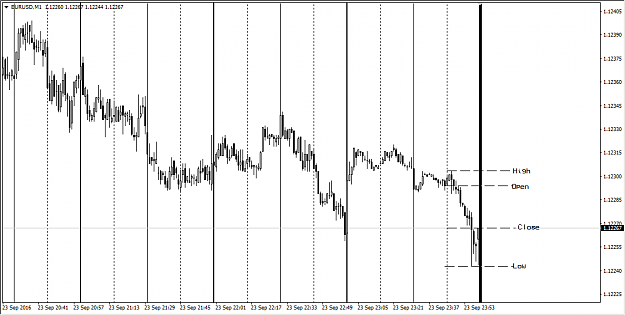
Anyway, by drawing vertical lines each 15 minutes for example (which are dashed vertical lines on my chart). You could easily draw an m15 candle in your head.
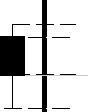
So once the price reaches a line we register the entry price as open, as price exits the zone by passing another vertical lines we register that as close. And just figure out the high and low.
Anyway, by drawing vertical lines each 15 minutes for example (which are dashed vertical lines on my chart). You could easily draw an m15 candle in your head.
So once the price reaches a line we register the entry price as open, as price exits the zone by passing another vertical lines we register that as close. And just figure out the high and low.
Attached Image (click to enlarge)
Attached Image
The truth is hidden from you