Thank you Epiphanic for these two amazing posts, I went down the same route but it seems you reached a deeper level.
"This becomes a particular problem when we want to use different measures of a candle to make decisions."
I wanted to share my interpretation of this sentence, the measures I found to happen inside any candlestick with good statistical occurrence. As CP say "an edge is a higher statistical occurrence", you're not granted to be profitable if you find one, problems will arise on how to put it into practice.
When you start analysing candlesticks OHLC data obviously you begin to search for common characteristics, one great example is that on average a candlestick is 50% body and 50% wicks... But that's the basics and you read about this everywhere, whether this implicates randomness inside markets is another topic. The next step is to gather some "expectancy", meaning "what can I expect from a candlestick"? This is when you start to look for the average range of each candlestick, so you know how much movement you can expect on any given candlestick relative to it's TFs; of course if the market wants to shoot 20x it's average range it will do, but I think it's a handy information knowing that with higher statistical occurrence after a certain range size (depends on TF) the observations of price going further will decrease. But this is not the edge I found.
Moving on I wanted to dig a little deeper, a candle has OHLC not just LH, so I started looking at average candlestick range in a "compartmentalised" way; meaning that I look for individual average OH-OL-OC. Of course at the beginning this just produced the same result outlined in previous paragraph, balance and no apparent edge.
I then imposed a restriction, I wanted to look only for bullish/bearish candles, this is when the balance tilted. If we look at all bullish candles average sizes, the average lower wick is no more equal to average higher wick, the average OC is no more equal to the sum of average wicks... Balance is shifted. For example, on bullish candles the average OH distance is ~3 times the average OL distance, and on bearish candles the average OL distance is ~3 times the average OH distance. This is the edge I found.
Those that traveled the same route already know where this eventually lead to, this is a breakout "conditional" strategy... If you want to trade this edge then you need to trade the development of a candlestick, the edge refers to a post-facto phenomenon (you don't know it's a bullish candle until it closes), so your only chance to take advantage of this is by trading candlestick's development. So... imagine we want to trade the development of a 1H candle, you can do it on a 1H chart of course, but remember: we're trying to take advantage of a post-facto edge, that means we'll be wrong many times. Hence it would make sense to trade this development on a lower chart, you can see more clearly the movement and potentially filter some bad signals. But, how do you trade this? There are at least 2 ways.
You know in bullish candles average OH is ~3 times average OL (eg. avg. OH=30 pips, avg. OL =10 pips), so one way would be to wait for a crossover of open line if the OL was <= 10pips, you would expect a 30 pips movement upward, this is why I said "conditional breakout". Needles to list all problems produced by this method.. What if candle open and shoot up without never going below open? In order to catch that you needed to open the trade at the very open of the candle. What if the candle is just fluctuating in a range and it casually cross open? Fakout and loss, it'll happen many times.
The next, slightly better, way I found was by imposing "limits" around the open, we know avg.OL in bullish candles is =10pips, the we place a line 10pips below the open... And another line 10 pips above open... If price cross the lower line then likely you're not inside what will be the lower wick of a bullish candle, if price cross the upper line then likely you're not inside what will be the higher wick of a bearish candle. Now you have solved one problem of the first method, still not profitable tough... Ranges and fakeouts would still kill you. But now you can remove the "conditional part", even if price travels more than 10 pips below lower line and then it start to reverse, shooting back up, and crossing the higher line, technically you're now inside a bullish candle and could go long... Problem of this is the "balancing" of the 2 lines, it happens only once every hour, and again fake-signals will be a huge problem.
I know these things can be tricky things to visualise if you did not went down this route, I apologise for not posting images... Me being lazy
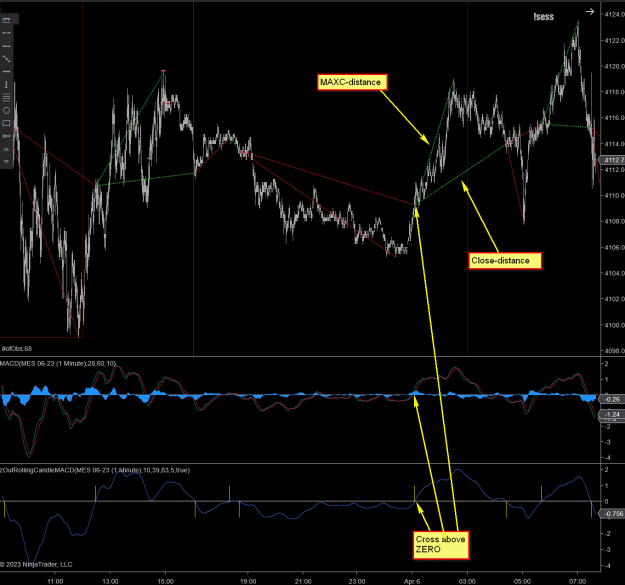
Is this a dead-end route or is it something we can take advantage of? Is there some way the wonderful posts by Epiphany can help trading this? I see rolling candles can solve frequency of balancing problem, I see using a median line can help both to filter signals and to give some exit indications. Epiphany I would really like your input on this, everyone's contribution is always appreciated.
"This becomes a particular problem when we want to use different measures of a candle to make decisions."
I wanted to share my interpretation of this sentence, the measures I found to happen inside any candlestick with good statistical occurrence. As CP say "an edge is a higher statistical occurrence", you're not granted to be profitable if you find one, problems will arise on how to put it into practice.
When you start analysing candlesticks OHLC data obviously you begin to search for common characteristics, one great example is that on average a candlestick is 50% body and 50% wicks... But that's the basics and you read about this everywhere, whether this implicates randomness inside markets is another topic. The next step is to gather some "expectancy", meaning "what can I expect from a candlestick"? This is when you start to look for the average range of each candlestick, so you know how much movement you can expect on any given candlestick relative to it's TFs; of course if the market wants to shoot 20x it's average range it will do, but I think it's a handy information knowing that with higher statistical occurrence after a certain range size (depends on TF) the observations of price going further will decrease. But this is not the edge I found.
Moving on I wanted to dig a little deeper, a candle has OHLC not just LH, so I started looking at average candlestick range in a "compartmentalised" way; meaning that I look for individual average OH-OL-OC. Of course at the beginning this just produced the same result outlined in previous paragraph, balance and no apparent edge.
I then imposed a restriction, I wanted to look only for bullish/bearish candles, this is when the balance tilted. If we look at all bullish candles average sizes, the average lower wick is no more equal to average higher wick, the average OC is no more equal to the sum of average wicks... Balance is shifted. For example, on bullish candles the average OH distance is ~3 times the average OL distance, and on bearish candles the average OL distance is ~3 times the average OH distance. This is the edge I found.
Those that traveled the same route already know where this eventually lead to, this is a breakout "conditional" strategy... If you want to trade this edge then you need to trade the development of a candlestick, the edge refers to a post-facto phenomenon (you don't know it's a bullish candle until it closes), so your only chance to take advantage of this is by trading candlestick's development. So... imagine we want to trade the development of a 1H candle, you can do it on a 1H chart of course, but remember: we're trying to take advantage of a post-facto edge, that means we'll be wrong many times. Hence it would make sense to trade this development on a lower chart, you can see more clearly the movement and potentially filter some bad signals. But, how do you trade this? There are at least 2 ways.
You know in bullish candles average OH is ~3 times average OL (eg. avg. OH=30 pips, avg. OL =10 pips), so one way would be to wait for a crossover of open line if the OL was <= 10pips, you would expect a 30 pips movement upward, this is why I said "conditional breakout". Needles to list all problems produced by this method.. What if candle open and shoot up without never going below open? In order to catch that you needed to open the trade at the very open of the candle. What if the candle is just fluctuating in a range and it casually cross open? Fakout and loss, it'll happen many times.
The next, slightly better, way I found was by imposing "limits" around the open, we know avg.OL in bullish candles is =10pips, the we place a line 10pips below the open... And another line 10 pips above open... If price cross the lower line then likely you're not inside what will be the lower wick of a bullish candle, if price cross the upper line then likely you're not inside what will be the higher wick of a bearish candle. Now you have solved one problem of the first method, still not profitable tough... Ranges and fakeouts would still kill you. But now you can remove the "conditional part", even if price travels more than 10 pips below lower line and then it start to reverse, shooting back up, and crossing the higher line, technically you're now inside a bullish candle and could go long... Problem of this is the "balancing" of the 2 lines, it happens only once every hour, and again fake-signals will be a huge problem.
I know these things can be tricky things to visualise if you did not went down this route, I apologise for not posting images... Me being lazy
Is this a dead-end route or is it something we can take advantage of? Is there some way the wonderful posts by Epiphany can help trading this? I see rolling candles can solve frequency of balancing problem, I see using a median line can help both to filter signals and to give some exit indications. Epiphany I would really like your input on this, everyone's contribution is always appreciated.
4