MY OPINION NOT FINANCIAL ADVISE
- #9,662
- Sep 15, 2021 1:36pm Sep 15, 2021 1:36pm
- Joined Jun 2009 | Status: Trader | 1,734 Posts
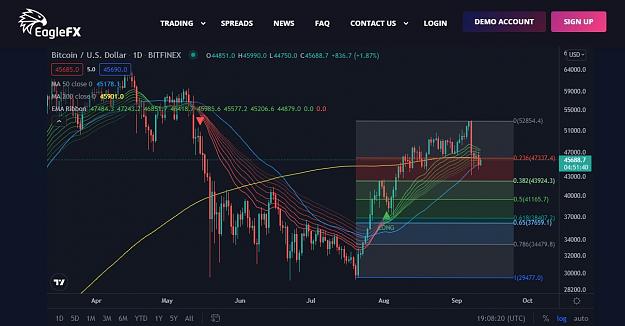
MY GRID. Markets are NOT random.
- #9,664
- Sep 15, 2021 4:18pm Sep 15, 2021 4:18pm
- Joined Apr 2010 | Status: Lazy trader on D1 charts | 5,901 Posts

- #9,665
- Sep 16, 2021 7:28am Sep 16, 2021 7:28am
- Joined Jun 2009 | Status: Trader | 1,734 Posts
MY GRID. Markets are NOT random.
- #9,666
- Sep 16, 2021 4:38pm Sep 16, 2021 4:38pm
- Joined Apr 2010 | Status: Lazy trader on D1 charts | 5,901 Posts
- #9,667
- Sep 16, 2021 8:20pm Sep 16, 2021 8:20pm
- | Joined Dec 2008 | Status: MMA Pro Wrestler | 17,579 Posts
I come from the future.
Karen X Mas Bonus 2025 All Time Profit:
$15,104
- #9,668
- Sep 17, 2021 12:00am Sep 17, 2021 12:00am
- | Joined Dec 2008 | Status: MMA Pro Wrestler | 17,579 Posts

I come from the future.
Karen X Mas Bonus 2025 All Time Profit:
$15,104
- #9,669
- Sep 17, 2021 5:46am Sep 17, 2021 5:46am
- | Joined Dec 2008 | Status: MMA Pro Wrestler | 17,579 Posts

I come from the future.
Karen X Mas Bonus 2025 All Time Profit:
$15,104
- #9,670
- Sep 17, 2021 10:31am Sep 17, 2021 10:31am
- | Joined Dec 2008 | Status: MMA Pro Wrestler | 17,579 Posts
I come from the future.
Karen X Mas Bonus 2025 All Time Profit:
$15,104
- #9,671
- Sep 17, 2021 4:07pm Sep 17, 2021 4:07pm
- Joined Apr 2010 | Status: Lazy trader on D1 charts | 5,901 Posts
- #9,673
- Sep 18, 2021 4:04pm Sep 18, 2021 4:04pm
- Joined Apr 2010 | Status: Lazy trader on D1 charts | 5,901 Posts

- #9,675
- Sep 19, 2021 4:05pm Sep 19, 2021 4:05pm
- Joined Apr 2010 | Status: Lazy trader on D1 charts | 5,901 Posts

- #9,676
- Sep 19, 2021 10:25pm Sep 19, 2021 10:25pm
- Joined Jun 2009 | Status: Trader | 1,734 Posts
MY GRID. Markets are NOT random.
- #9,677
- Sep 20, 2021 6:06am Sep 20, 2021 6:06am
- Joined Oct 2010 | Status: Trader | 4,465 Posts
Follow The Markets Structure - Patience and Discipline
- #9,678
- Sep 20, 2021 6:18am Sep 20, 2021 6:18am
- Joined Oct 2010 | Status: Trader | 4,465 Posts
Follow The Markets Structure - Patience and Discipline

- #9,680
- Sep 20, 2021 11:26am Sep 20, 2021 11:26am
- Joined Mar 2008 | Status: Name real with real own way | 23,423 Posts
Not understand?better not follow my analyses!doubt clearer first, risks ++