hi lady_luck,
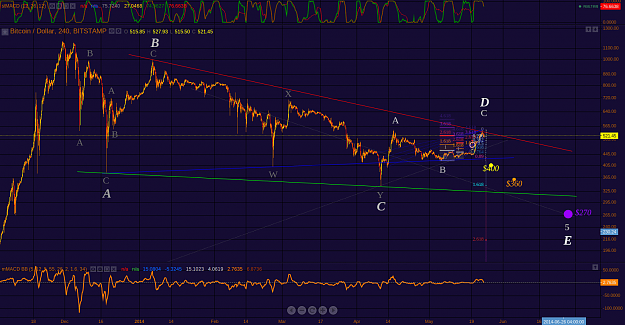
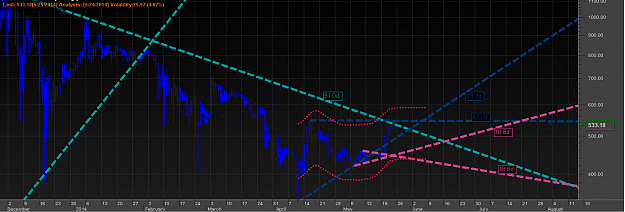
There is a BTCe chart missing from my previous post I' having trouble updating it - not sure if it's a Forex Factory bug or my internet connection, so i'll just post it here:
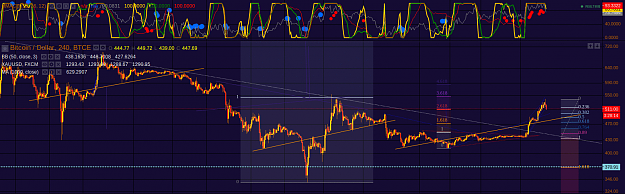
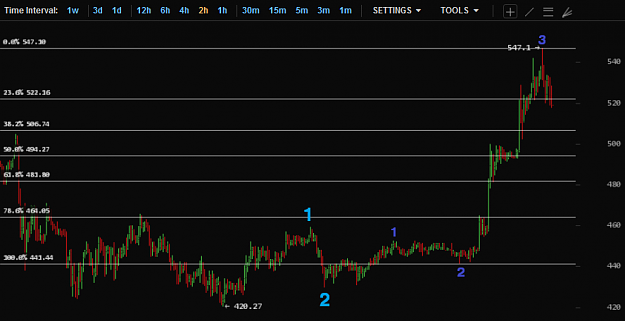
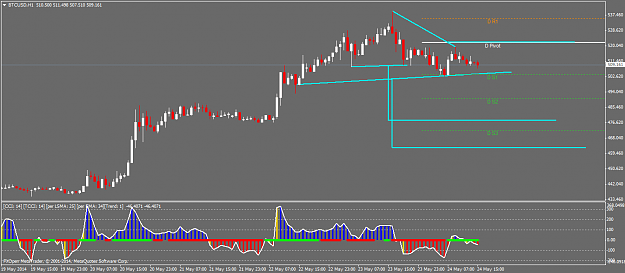
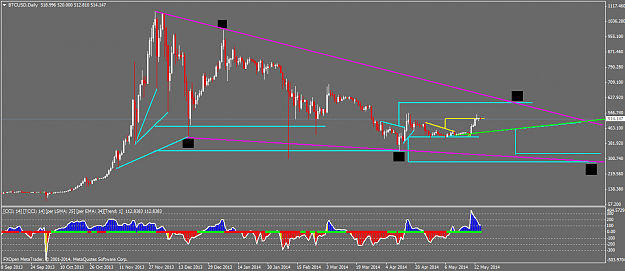
What's difficult to understand with this wave up is that it started gradually, so it's difficult to know what started it... the previous 3 wave structure (from 340) during the decline?, or this messy sideways during May? So drawing channel TLs now is impossible because it's early in the advance - and it's looking very much like a strong advance is underway.
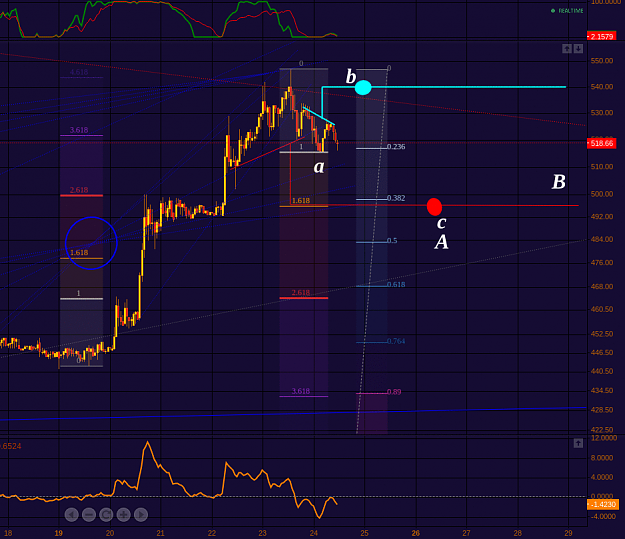
There is also the subwave structure of each wave in the advance. I'm seeing a-b-c in each push up - the 1st wave in each case has 3 waves and stands apart from what follows each time. So, yes, that's a diagonal signature. But where do we start counting this diagonal from? And without knowing the start, where do we draw it's channel lines?
If this wave up started from near 400 then it could be a leading diagonal (that explains the wide base) - yet if we have a leading diag, then we can be sure that wave 4 will come into the price territory of wave 1 - which is about 420.
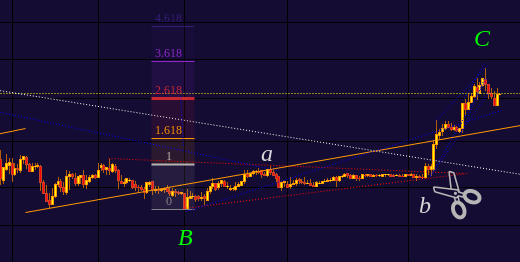
If it's just a plain vanilla diag (not leading) then matter is open ended - we can expect a 4th wave drop to the Fib you mention and then expect a powerful 5th wave to near 700 or 800. I'm not positioned for that and would prefer a deeper correction.
There is a BTCe chart missing from my previous post I' having trouble updating it - not sure if it's a Forex Factory bug or my internet connection, so i'll just post it here:
Attached Image (click to enlarge)
What's difficult to understand with this wave up is that it started gradually, so it's difficult to know what started it... the previous 3 wave structure (from 340) during the decline?, or this messy sideways during May? So drawing channel TLs now is impossible because it's early in the advance - and it's looking very much like a strong advance is underway.
There is also the subwave structure of each wave in the advance. I'm seeing a-b-c in each push up - the 1st wave in each case has 3 waves and stands apart from what follows each time. So, yes, that's a diagonal signature. But where do we start counting this diagonal from? And without knowing the start, where do we draw it's channel lines?
If this wave up started from near 400 then it could be a leading diagonal (that explains the wide base) - yet if we have a leading diag, then we can be sure that wave 4 will come into the price territory of wave 1 - which is about 420.
If it's just a plain vanilla diag (not leading) then matter is open ended - we can expect a 4th wave drop to the Fib you mention and then expect a powerful 5th wave to near 700 or 800. I'm not positioned for that and would prefer a deeper correction.
cryptocurrency everytime