Dear fellow Traders,
I have developed this strategy for eur/usd, and backtested it using amibroker. I got the following results Which I have attached along with this thread.
But the ulcer index is too high , maybe it is because of 1:20 leverage which i m taking in the strategy.
I wanted the valueable feedback from this forum. It will be of great help if u give me ur insights as to wether I shud trade live using this strategy or not.
Highlights of the strategy
Initial capital 25000.00
Ending capital 41993.61
Net Profit 16993.61
Net Profit % 67.97 %
Ulcer index 8.38
CAR/MaxDD 2.29
Profit factor 1.10
Standard error 2379
Max drawdown percent -29.33%
No of trades 2150
The rest of the statistics are in the word document. TIme frame I have chosen is 5mins, On higher time frames, the results r better but the anual ROI is less.
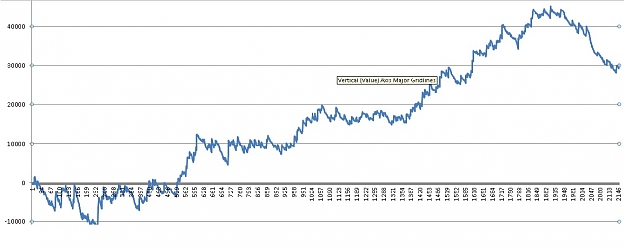
I have used one years data to test this Strategy from 10/10/2011 to 10/10/2012. As the time frame is 5 mins... is this much data enough to validate the backtesting? Also I have attached the chart of the Equity curve which looks a bit funny. The Equity curve which I have posted here is with a constant lot size of 125000. ... kindly advice .
I have developed this strategy for eur/usd, and backtested it using amibroker. I got the following results Which I have attached along with this thread.
But the ulcer index is too high , maybe it is because of 1:20 leverage which i m taking in the strategy.
I wanted the valueable feedback from this forum. It will be of great help if u give me ur insights as to wether I shud trade live using this strategy or not.
Highlights of the strategy
Initial capital 25000.00
Ending capital 41993.61
Net Profit 16993.61
Net Profit % 67.97 %
Ulcer index 8.38
CAR/MaxDD 2.29
Profit factor 1.10
Standard error 2379
Max drawdown percent -29.33%
No of trades 2150
The rest of the statistics are in the word document. TIme frame I have chosen is 5mins, On higher time frames, the results r better but the anual ROI is less.
I have used one years data to test this Strategy from 10/10/2011 to 10/10/2012. As the time frame is 5 mins... is this much data enough to validate the backtesting? Also I have attached the chart of the Equity curve which looks a bit funny. The Equity curve which I have posted here is with a constant lot size of 125000. ... kindly advice .
Attached Image (click to enlarge)
Attached File(s)