Hi Guys,
Thought this idea may benefit those that are trading using range bars?
What if you could see inside the range bars?
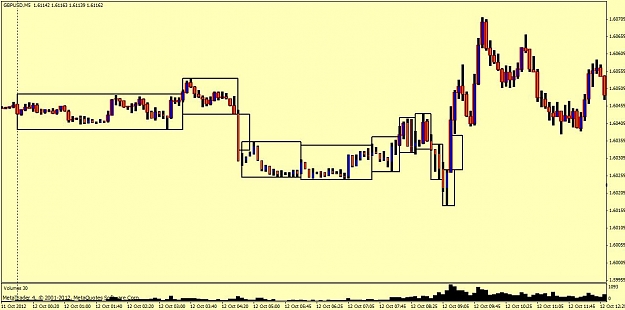
An indicator could be created as shown in the picture. (M5 normal time bar chart)
What I think this may show, is a change in momentum.
The picture shows cable during an asian session, see how the first box
takes ages to form an upbar with a range of 10 pips, then the second box
takes a third of the time to form a down bar.
Range bars eliminate the time from price movement but I think they would
be better if you could see what is happening in them.
Specifically, I want to see if these new 'time based range bars' can show
that a slow down bar followed by a fast upbar is a repeated price
movement which can then be exploited.
I have done a search for this indicator on FF but don't think it has been
done yet.
Let me know what you think guys?
Thanks Slim
Thought this idea may benefit those that are trading using range bars?
What if you could see inside the range bars?
An indicator could be created as shown in the picture. (M5 normal time bar chart)
What I think this may show, is a change in momentum.
The picture shows cable during an asian session, see how the first box
takes ages to form an upbar with a range of 10 pips, then the second box
takes a third of the time to form a down bar.
Range bars eliminate the time from price movement but I think they would
be better if you could see what is happening in them.
Specifically, I want to see if these new 'time based range bars' can show
that a slow down bar followed by a fast upbar is a repeated price
movement which can then be exploited.
I have done a search for this indicator on FF but don't think it has been
done yet.
Let me know what you think guys?
Thanks Slim
Attached Image (click to enlarge)