Hi everyone!
In this thread I will show you how I intrerpret Forex daily price action by showing some real trades made with real money. I also tell why I took the trade and how it worked.
I use no indicators or fundamentals or news, just raw price and my eye.
Sorry my english is not so fluent, but hopefully somewhat understandable.
I don't recommend anyone to trade anything that way or give any tips. So please don't blame me if the information doesn't work for you or fit your style.
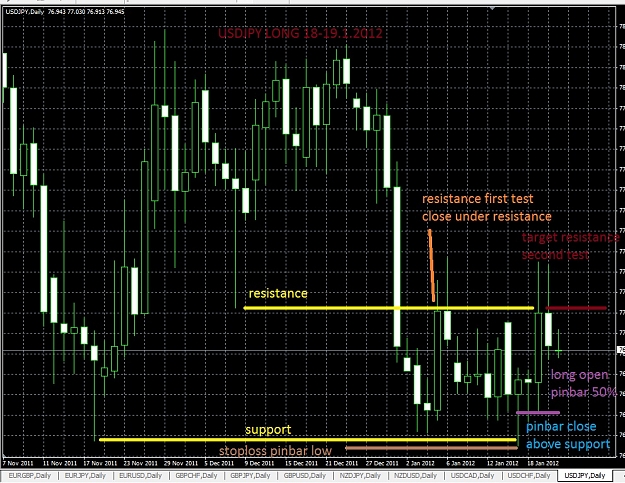
The first trade is USDJPY long (see picture).
open 18.1.2012 @ 76,694
stoploss @ 76,54
close 19.1.2012 @ 77,121
Reward/Risk=2,8
And now full explanation why I took that trade.
There is strong support made by pinbar 8.12.2011 @ 77,121. That support broke through 30.12.2011. Then support became resistance. That resistance tested successfully first time 5.1.2012 by closing under the line. That line is target for the long trade as second test.
There is bullish pinbar formed 17.1.2012 when price rejected support level @ 76,567. Note that its importat to get signal candle's close at the side of trade.
Long open trade level is half way of the pinbar.
Stoploss is placed 5 pips under pinbar low. Thats because you have to allow market to kiss pinbar low without being stopped out.
Reward/Risk criterion has to be over 2:1 to trade to be worth taking.
Have a nice day and see you soon.
finnforex
In this thread I will show you how I intrerpret Forex daily price action by showing some real trades made with real money. I also tell why I took the trade and how it worked.
I use no indicators or fundamentals or news, just raw price and my eye.
Sorry my english is not so fluent, but hopefully somewhat understandable.
I don't recommend anyone to trade anything that way or give any tips. So please don't blame me if the information doesn't work for you or fit your style.
The first trade is USDJPY long (see picture).
open 18.1.2012 @ 76,694
stoploss @ 76,54
close 19.1.2012 @ 77,121
Reward/Risk=2,8
And now full explanation why I took that trade.
There is strong support made by pinbar 8.12.2011 @ 77,121. That support broke through 30.12.2011. Then support became resistance. That resistance tested successfully first time 5.1.2012 by closing under the line. That line is target for the long trade as second test.
There is bullish pinbar formed 17.1.2012 when price rejected support level @ 76,567. Note that its importat to get signal candle's close at the side of trade.
Long open trade level is half way of the pinbar.
Stoploss is placed 5 pips under pinbar low. Thats because you have to allow market to kiss pinbar low without being stopped out.
Reward/Risk criterion has to be over 2:1 to trade to be worth taking.
Have a nice day and see you soon.
finnforex
Attached Image (click to enlarge)