Good evening everyone.
I appreciate if it is possible to respond positively or negatively to the request.
It is possible to code a written indicator from TradingView to MT4.
Follow the link to the source code with the information, and I will also put it below.
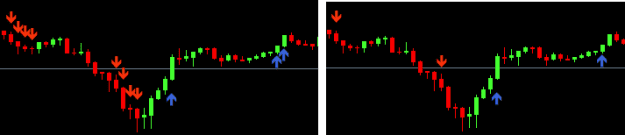
I would like to know if it would be possible to also add vertical lines when the balls (needles) are indicated, but with the option to enable and disable. This functionality is not described in the source code.
I await your considerations.
Thanks.
https://br.tradingview.com/script/rZttGesK/
========== Full Open Code - Adail-Index - Tradingview - Version DELTA ====================
// This source code is subject to the terms of the Mozilla Public License 2.0 at https://mozilla.org/MPL/2.0/
// Adail1321
//@version=5
indicator(title="Adail-Index", shorttitle="Adail-Index (versão DELTA)", precision=4)
//SMAs
SMA1 = ta.sma(close,1)
SMA3 = ta.sma(close, 3)
SMA8 = ta.sma(close, 8)
SMA20 = ta.sma(close,20)
SMA1O = ta.sma(open,1)
//DIFS
d38 = ((SMA3 - SMA8) / SMA8) * 100
d208 = ((SMA20 - SMA8) / SMA8) * 100
d18 = ((SMA1 - SMA8) / SMA8) * 100
dO18 = ((SMA1O - SMA8) / SMA8) * 100
osc = d38 - d208
//VOL
dp8 = ta.stdev(close, 8)
srs = ((2 * dp8) / SMA8) * 100
sri = ((-2 * dp8) / SMA8) * 100
sr1 = plot(srs, color=#F0E68C, transp=100)
sr2 = plot(sri, color=#F0E68C, transp=100)
fill(sr1, sr2, color=#FBEFEF, transp=80)
// Plot osc
plot(osc, title="OSCDI", color=(osc >= 0 ? (osc[1] < osc ? #00FF00 : #BF00FF) : (osc[1] < osc ? #DF7401 : #FF0000)), linewidth = 1)
// Plot I20/8
plot(d208, title="I20/8", color=(d208 >= 0 ? (d208[1] < d208 ? #FF0000 : #DAA520) : (d208[1] < d208 ? #BF00FF : #00FF00)), linewidth = 4)
// Plot I3/8
plot(d38, title="I3/8", color=#FBEFEF, linewidth = 4)
// Plot
plot(d18, style=plot.style_histogram, color=#00FFFF, linewidth=3)
plot(dO18, style=plot.style_histogram, color=#FFFF00, linewidth=3)
hline(0, "N1", color=#FFFF00)
band1 = hline(3, "N2", color=#F0F8FF)
band2 = hline(5, "N2", color=#F0F8FF)
band3 = hline(10, "N3", color=#F0F8FF)
band4 = hline(-3, "N2", color=#F0F8FF)
band5 = hline(-5, "N3", color=#F0F8FF)
band6 = hline(-10, "N3", color=#F0F8FF)
//Needles
_high = (d18 > 0) and (dO18 < 0) and (d18 > d38) and (d18 > d208) and (dO18 < d38) and (dO18 < d208)
_low = (d18 < 0) and (dO18 > 0) and (d18 < d38) and (d18 < d208) and (dO18 > d38) and (dO18 > d208)
//BarColor
needles_colors = _high ? #00FFFF : (_low ? #FFFF00 : na)
barcolor(needles_colors)
//IndicatorColor
plot(_high ? 0 : na, title="HN", style=plot.style_circles, linewidth=7, color=#00FFFF)
plot(_low ? 0 : na, title="LN", style=plot.style_circles, linewidth=7, color=#FFFF00)
==================================== END ===========================================
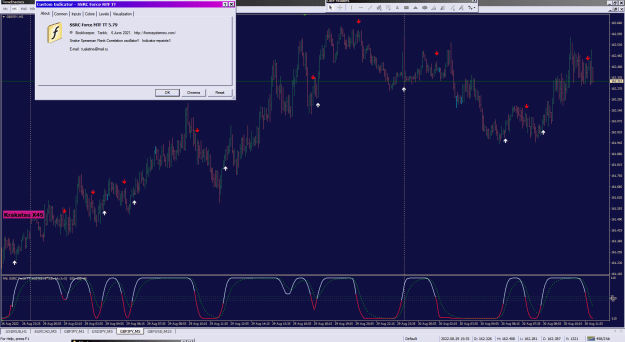
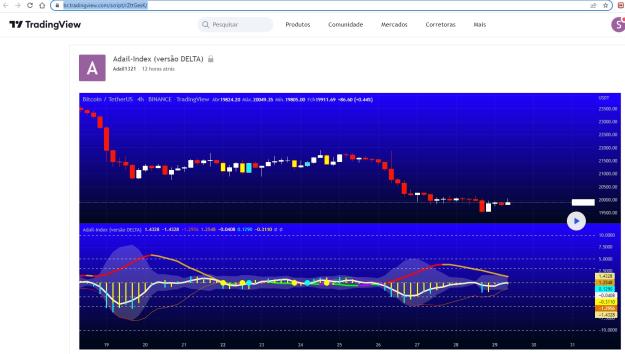
It is an indicator inspired by Didi=Index, but with the following SUPPLEMENTS: Bollinger Bands , Needle Detector with 100% accuracy, Trend Strength Indicator and Trend Tracker Coloring Scheme.
Observation:
> thicker colored line is the I20/8 indicator;
> white line is the I3/8 indicator;
> thinner colored line is the Trend Strength Indicator.
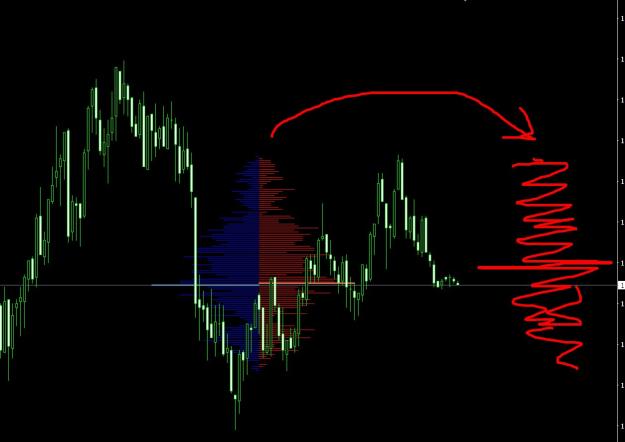
The blue and yellow columns also function as force indicators and serve to detect needle sticks.
No tolerance up to the 1% level to confirm a stronger downtrend.
In the DELTA version: automatic needling detection; marking on the center line of the indicator; candles also marked; yellow for low needle; blue for high needle.
Horizontal levels are most recommended for weekly, daily and 4-hour charts (more compatible with swing trading).
For smaller timeframes, preferred for daytrade, it is recommended to remove the horizontal lines or test other levels.
====================================================================
If it makes it easier, the source code of the DIDI Index indicator, which gave rise to this revival and improvement of the new ADAIL-INDEX indicator, is attached.
attached in .txt the source code of the Delta version (tradingview)
I appreciate if it is possible to respond positively or negatively to the request.
It is possible to code a written indicator from TradingView to MT4.
Follow the link to the source code with the information, and I will also put it below.
I would like to know if it would be possible to also add vertical lines when the balls (needles) are indicated, but with the option to enable and disable. This functionality is not described in the source code.
I await your considerations.
Thanks.
https://br.tradingview.com/script/rZttGesK/
Attached Image (click to enlarge)
========== Full Open Code - Adail-Index - Tradingview - Version DELTA ====================
// This source code is subject to the terms of the Mozilla Public License 2.0 at https://mozilla.org/MPL/2.0/
//
//@version=5
indicator(title="Adail-Index", shorttitle="Adail-Index (versão DELTA)", precision=4)
//SMAs
SMA1 = ta.sma(close,1)
SMA3 = ta.sma(close, 3)
SMA8 = ta.sma(close, 8)
SMA20 = ta.sma(close,20)
SMA1O = ta.sma(open,1)
//DIFS
d38 = ((SMA3 - SMA8) / SMA8) * 100
d208 = ((SMA20 - SMA8) / SMA8) * 100
d18 = ((SMA1 - SMA8) / SMA8) * 100
dO18 = ((SMA1O - SMA8) / SMA8) * 100
osc = d38 - d208
//VOL
dp8 = ta.stdev(close, 8)
srs = ((2 * dp8) / SMA8) * 100
sri = ((-2 * dp8) / SMA8) * 100
sr1 = plot(srs, color=#F0E68C, transp=100)
sr2 = plot(sri, color=#F0E68C, transp=100)
fill(sr1, sr2, color=#FBEFEF, transp=80)
// Plot osc
plot(osc, title="OSCDI", color=(osc >= 0 ? (osc[1] < osc ? #00FF00 : #BF00FF) : (osc[1] < osc ? #DF7401 : #FF0000)), linewidth = 1)
// Plot I20/8
plot(d208, title="I20/8", color=(d208 >= 0 ? (d208[1] < d208 ? #FF0000 : #DAA520) : (d208[1] < d208 ? #BF00FF : #00FF00)), linewidth = 4)
// Plot I3/8
plot(d38, title="I3/8", color=#FBEFEF, linewidth = 4)
// Plot
plot(d18, style=plot.style_histogram, color=#00FFFF, linewidth=3)
plot(dO18, style=plot.style_histogram, color=#FFFF00, linewidth=3)
hline(0, "N1", color=#FFFF00)
band1 = hline(3, "N2", color=#F0F8FF)
band2 = hline(5, "N2", color=#F0F8FF)
band3 = hline(10, "N3", color=#F0F8FF)
band4 = hline(-3, "N2", color=#F0F8FF)
band5 = hline(-5, "N3", color=#F0F8FF)
band6 = hline(-10, "N3", color=#F0F8FF)
//Needles
_high = (d18 > 0) and (dO18 < 0) and (d18 > d38) and (d18 > d208) and (dO18 < d38) and (dO18 < d208)
_low = (d18 < 0) and (dO18 > 0) and (d18 < d38) and (d18 < d208) and (dO18 > d38) and (dO18 > d208)
//BarColor
needles_colors = _high ? #00FFFF : (_low ? #FFFF00 : na)
barcolor(needles_colors)
//IndicatorColor
plot(_high ? 0 : na, title="HN", style=plot.style_circles, linewidth=7, color=#00FFFF)
plot(_low ? 0 : na, title="LN", style=plot.style_circles, linewidth=7, color=#FFFF00)
==================================== END ===========================================
Attached Image (click to enlarge)
It is an indicator inspired by Didi=Index, but with the following SUPPLEMENTS: Bollinger Bands , Needle Detector with 100% accuracy, Trend Strength Indicator and Trend Tracker Coloring Scheme.
Observation:
> thicker colored line is the I20/8 indicator;
> white line is the I3/8 indicator;
> thinner colored line is the Trend Strength Indicator.
The blue and yellow columns also function as force indicators and serve to detect needle sticks.
No tolerance up to the 1% level to confirm a stronger downtrend.
In the DELTA version: automatic needling detection; marking on the center line of the indicator; candles also marked; yellow for low needle; blue for high needle.
Horizontal levels are most recommended for weekly, daily and 4-hour charts (more compatible with swing trading).
For smaller timeframes, preferred for daytrade, it is recommended to remove the horizontal lines or test other levels.
====================================================================
If it makes it easier, the source code of the DIDI Index indicator, which gave rise to this revival and improvement of the new ADAIL-INDEX indicator, is attached.
Attached File(s)
attached in .txt the source code of the Delta version (tradingview)
Attached File(s)