Happy and prosperous new year to you all coders and all traders in the house. Please i have this indicator that does not update its signal unless i click on indicator list, and bring it out, click ok, before the arrows can show up, i believe there could be some errors that is not allowing auto update, for the arrows to pop up at the appropriate time. Kindly help me to check the indicator and correct whatever error that is hindering the arrows to come up on chart on all time frame. Thanking you in advance for your precious time.
Could someone possibly fix this indicator so that it ONLY shows the last day if you choose 1 for "days used" I would like for it to ONLY show the day before. Currently if you use this indicator on Monday then you have to select 3 days back to account for the weekend, but by the time you get out to Wed it's showing all 3 days. I would like to be able to use this indicator and be able to select 1 and ONLY see the previous day's close....regardless if it's on a Monday or a Thursday. If it's a Monday and I have selected 1 day back, it should show Friday's Close price. Also if possible please remove the line that always appears on the chart for the current day upcoming candle close. I'm just trying to clean up the chart and not have so many unnecessary lines. TYVM
PS.......If it happens to be one of you amazing coders that knows how to add a "on/off" button to it, that would be much appreciated if you could add that to it. Not a big deal though, only if you are feeling extra generous with your time. TYVM!
{quote} cja mate you are right you though right way highest high-lowest low with little tweak please check( ATTACHED IMAGE ALL LOGIC ) it is based on logic to draw supply demand decision point and i do manually and you also help me a lot in past . if it is possible create indicator exact image or just highest high ,lowest low to catch impulse move , buy-sell decision or price departure zone . one image is better than 100 words. i am eagerly waiting see another great creation . thanks in advance. ###to avoid a lot of zone we must consider price break...
Ignored
Drawing the areas manually on historical charts is fine but it appears to me what you are basically asking for is a non repaint zigzag which when it turns it is a solid non repainting signal? Realistically you are basically asking for the holy grail. There are a whole lot of indicators that use highest highs lowest lows and historically they look fantastic but on a live feed are virtually impossible to trade. The best support and resistance I believe are the lines you draw manually off the higher timeframes. I will have a look through my data base and check out all the support/resistance indicators I have and see if any of them approach what I do manually.
{quote} 0.0 Finger crossed try this, is there any error msg? on a normal live chart the msgs are in the experts tab of the terminal. I recall you used 2 day mtf on a 15min chart, I used that for the gif. {image} {file}
Ignored
Hi there jeanlouie thanks for your amazing post and coding, can you edit this indicator for the color codes to start when the regression starts as well, and not to extend?
And the regression moves as the price moves. Something like in the images.
{quote} Drawing the areas manually on historical charts is fine but it appears to me what you are basically asking for is a non repaint zigzag which when it turns it is a solid non repainting signal? Realistically you are basically asking for the holy grail. There are a whole lot of indicators that use highest highs lowest lows and historically they look fantastic but on a live feed and are virtually impossible to trade. The best support and resistance I believe are the lines you draw manually off the higher timeframes. I will have a look through...
Ignored
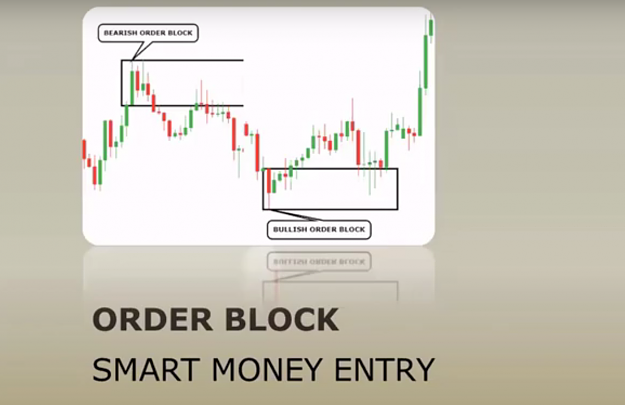
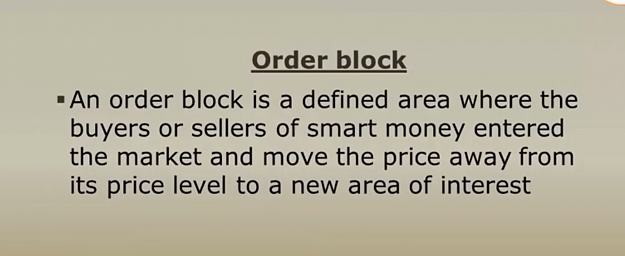
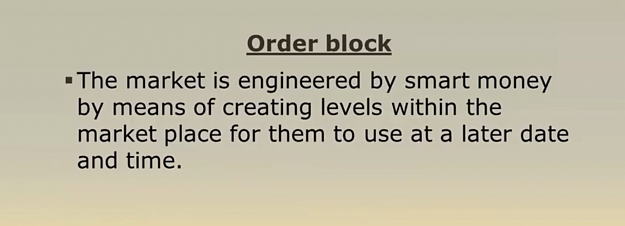
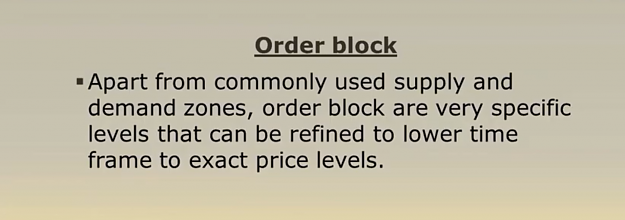
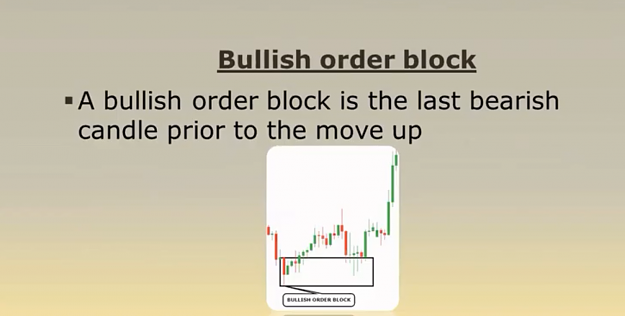
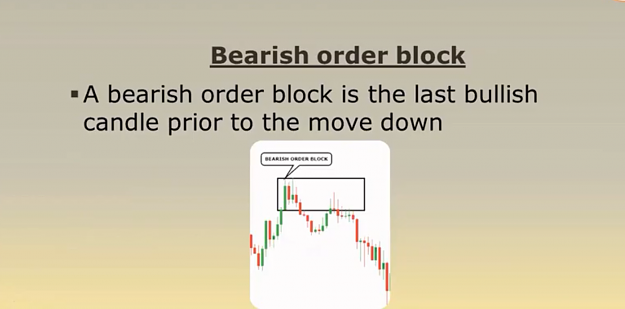
this is ict bullish bearish order block which i am looking for a long time but my bad luck may be i cant express though i attached a lot of image many time one more try if you search google or you tube you will be find a ton post /image article but not indicator may be it is possible to code, i don't know. one more try with details along with image.
{quote} this is ict bullish bearish order block which i am looking for a long time but my bad luck may be i cant express though i attached a lot of image many time one more try if you search google or you tube you will be find a ton post /image article but not indicator may be it is possible to code, i don't know. one more try with details along with image. {image} {image} {image} {image} {image} {image}
Ignored
OK so what actually determines a Bullish/Bearish order block?? You can post all the charts historically showing Bullish/Bearish moves as you like but it does not mean anything. I can look at a chart historically and mark all the bullish/bearish moves but what specific pattern/sequence validates a signal on a live Market feed?
As I said previously take zigzag for example, I can show you every Bullish/Bearish move on a historical chart with zigzag loaded on it but try and trade those moves as they are forming live??
{quote} OK so what actually determines a Bullish/Bearish order block?? You can post all the charts historically showing Bullish/Bearish moves as you like but it does not mean anything. I can look at a chart historically and mark all the bullish/bearish moves but what specific pattern/sequence validates a signal on a live Market feed? As I said previously take zigzag for example, I can show you every Bullish/Bearish move on a historical chart with zigzag loaded on it but try and trade those moves as they are forming live??
Ignored
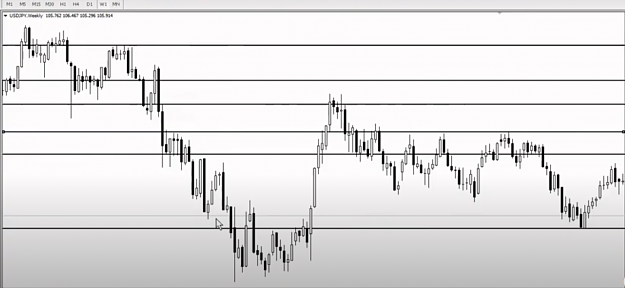
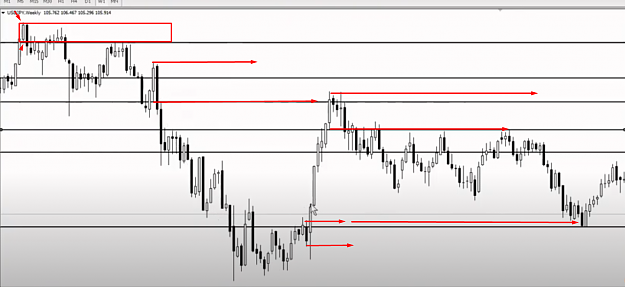
i have zero knowledge about coding as far i understand zigzag or fractal catch every swing/fractal but order block catch impulse move that mean if price break previous high-low or equal high low which is the main criterion of order lock and differ from zigzag /fractal/swing. you can seee attached image how horizontal draw last green candle before go down and red candle before go up .i st image only horizontal line and 2nd image orderblock (manually) i don't want you bother you more . many many thanks for your time.
bearish order block=last green candle before go down and (draw h line last green candle high to low and extend right)
bullish red candle before go up (draw h line candle low to high and extend to right))
double top-bottom touch/break/reject/bounce
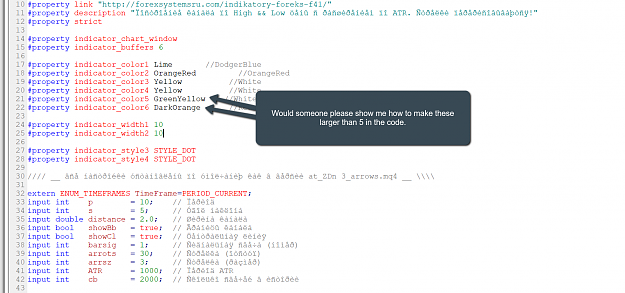
can someone please tell me how I can make 5 and 6 larger in the code{image}
Ignored
Attached Image
If #property indicator_width1 10 and #property indicator_width2 10 works, do the same for 5 and 6.
ie;
#property indicator_width5 10
#property indicator_width6 10
{quote} {image} If #property indicator_width1 10 and #property indicator_width2 10 works, do the same for 5 and 6. ie; #property indicator_width5 10 #property indicator_width6 10
Ignored
hello!
Thank you so much but the buffer still there .
This is what i need
{quote} hello! Thank you so much but the buffer still there . This is what i need {image}
Ignored
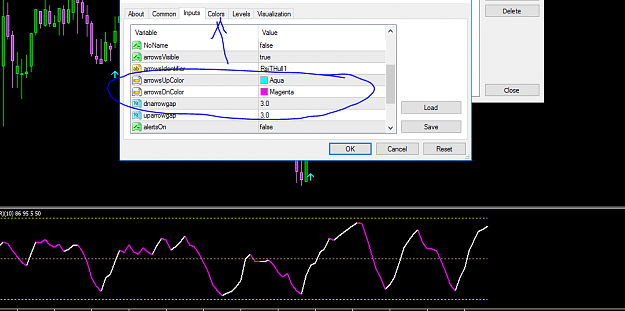
They are not using buffers. They are generated by a "draw arrow" fuction.. That's why are are where they are.
It would be helpful if you explain exactly what you want so you don't waste peoples time.
{quote} They are not using buffers. They are generated by a "draw arrow" fuction.. That's why are are where they are. It would be helpful if you explain exactly what you want so you don't waste peoples time.
Ignored
So i want to made 2 arrows like that arrow.
Could you make it be buffers?
Make sure it on color tab and will not repaint
{quote} ... can you edit this indicator for the color codes to start when the regression starts as well, and not to extend? And the regression moves as the price moves. Something like in the images...
Ignored
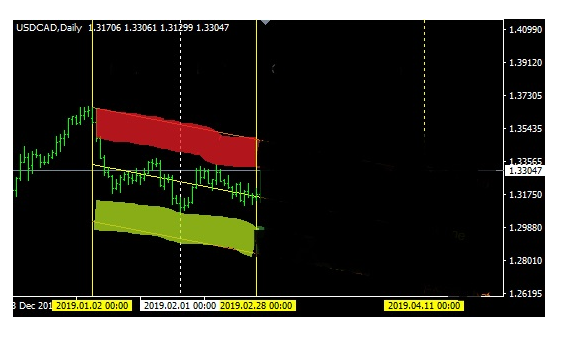
Linear_Regression_Lines_auto_mtf_v1.21
- filled channel starts from start of period used
- all lines n channels have projection optoin
on default
Attached Image
with projections and labels off, and including the live bar
{quote} Linear_Regression_Lines_auto_mtf_v1.21 - filled channel starts from start of period used - all lines n channels have projection optoin on default {image} with projections and labels off, and including the live bar {image} {file}
{quote} Here is the source code to this @classy {file}{file}
Ignored
cja you know already one of our friends all ready created orderblock but mt5 thanks. i am looking for just mt4 so i requested him for source code and he produced but still no luck ?and ganz and you are saying it is just simple zigzag or fractal so i am really confused because of my zero knowledge