I had to make this new thread because the old one got very confusing to everyone including me, with the various EA's and settings.
In this thread, we will not be discussing any EA's just the plain simple manual trades.
We will also discuss when to trade and when to avoid trading altogether.
The Setup:
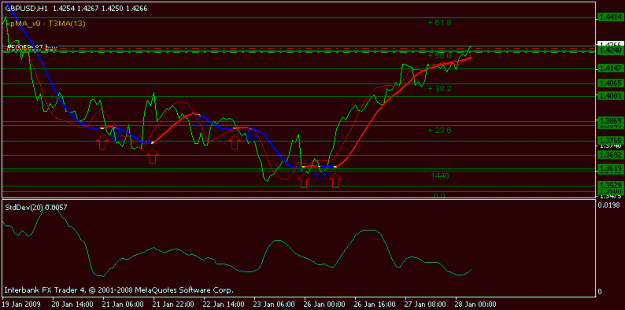
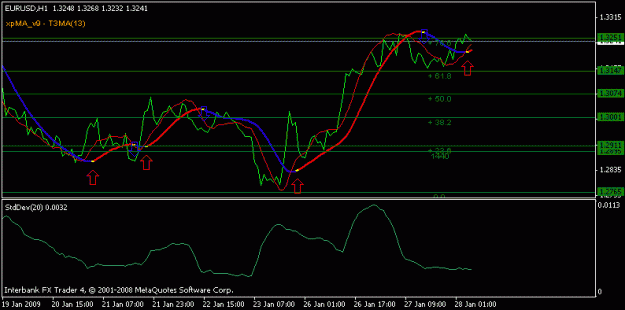
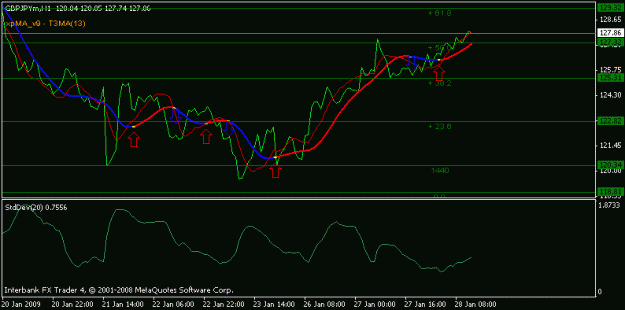
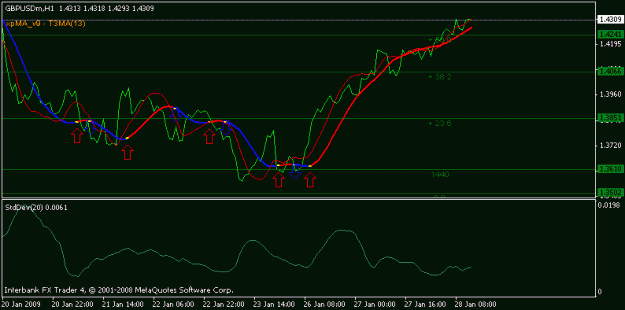
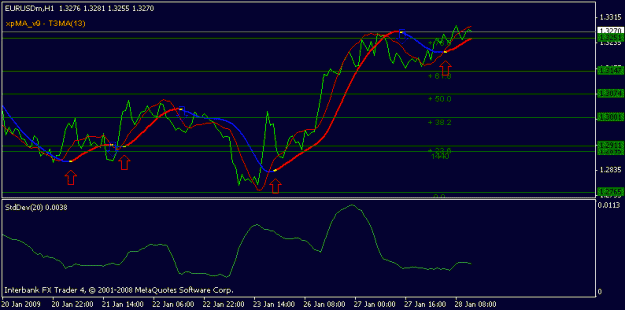
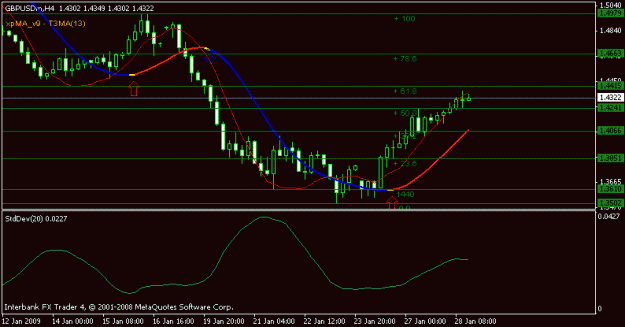
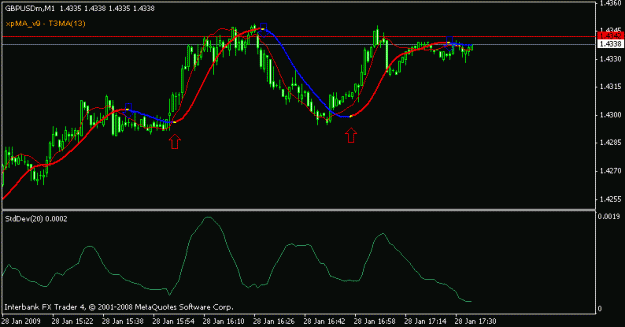
Its all given in the template file attached, we trade 1 hour charts.
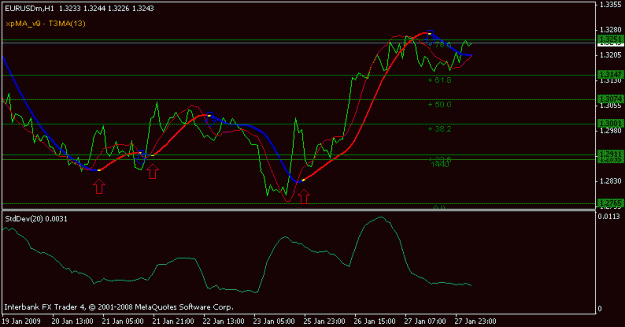
When to Enter A Trade:
Watch for a possible spike in the standard deviation, this is when we enter a trade and when this spike ends, we close the trade.
Standard deviation measures volatility in the market, and hence maximum moves.
The direction to Choose:
The direction to choose is defined by the xpma and tsf cross, if xpma is blue we short, wif it is red we long.
Remember:
If there is no volatility, we simply do not bother trading, there is no use wasting time.
How do we figure out the future volatility?
Now this is one important question, watch the angle of the xpma like with respect to base, if it is trending then there are chances of increase in volatility, if it is flat then the markets are dead.
The fib Lines:
The fib lines are based on reversal patterns, hence very accurate, choose the one that satisfies your risk appetite.
Since I trade managed accounts its compulsory for me to have quality in trades to be able to perform better.
In this thread, we will not be discussing any EA's just the plain simple manual trades.
We will also discuss when to trade and when to avoid trading altogether.
The Setup:
Its all given in the template file attached, we trade 1 hour charts.
When to Enter A Trade:
Watch for a possible spike in the standard deviation, this is when we enter a trade and when this spike ends, we close the trade.
Standard deviation measures volatility in the market, and hence maximum moves.
The direction to Choose:
The direction to choose is defined by the xpma and tsf cross, if xpma is blue we short, wif it is red we long.
Remember:
If there is no volatility, we simply do not bother trading, there is no use wasting time.
How do we figure out the future volatility?
Now this is one important question, watch the angle of the xpma like with respect to base, if it is trending then there are chances of increase in volatility, if it is flat then the markets are dead.
The fib Lines:
The fib lines are based on reversal patterns, hence very accurate, choose the one that satisfies your risk appetite.
Since I trade managed accounts its compulsory for me to have quality in trades to be able to perform better.
Attached Image (click to enlarge)
Attached File(s)