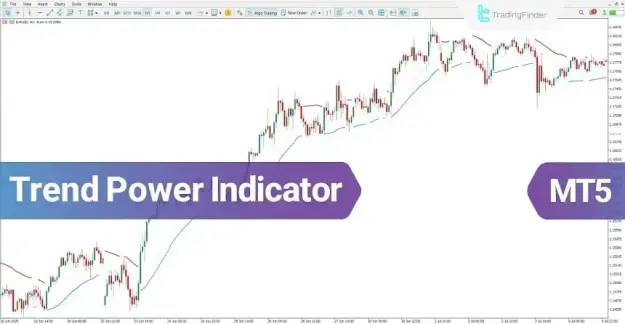


Designed for multiple asset classes and trading styles, the Trend Power Indicator assists traders in identifying high-probability buy and sell opportunities within trending markets.
 You can download it from this link:
https://cdn.tradingfinder.com/file/5...-mt5-tflab.zip
 You can also access the MetaTrader 4 version of this Indicator through this page:
https://www.cryptocraft.com/thread/1...oad-free-tflab
 For instructions on how to install:
https://www.forexfactory.com/thread/...-in-metatrader
Prop Firm DrawDown Protector : Prop Firm Capital Protection Expert MT5 |Forex Money Management: Forex Trade Management Expert MT5 | ICT Concepts Indicator MT5 |Smart Money Concepts Expert MT5 | Smart Money Trap Scanner | Get a free Expert Advisor license via Telegram and WhatsApp
Trend Power Indicator Specifications
Indicator Categories
- Signal & Forecast Indicators
- Trading Assistance Indicators
- Moving Average Indicators
Trading Platform
- MetaTrader 5
Experience Level
- Beginner-Friendly
Indicator Type
- Reversal Detection Indicator
Supported Timeframes
- Multi-Timeframe Compatible
Suitable Trading Methods
- Scalping
- Day Trading
- Swing Trading
Supported Markets
- Forex
- Cryptocurrency
- Stocks
Understanding the Trend Power Indicator
The indicator uses a color-based trend line to visualize current market conditions and trend strength.
Its signals are interpreted as follows:
- A blue line reflects bullish market sentiment and increasing buying momentum.
- A red line reflects bearish market sentiment and growing selling pressure.
- A discontinuous or fluctuating line structure around price candles suggests a consolidation phase with limited directional momentum.
This simplified visual approach allows traders to identify market conditions quickly and make informed trading decisions.
Bullish Trend Setup
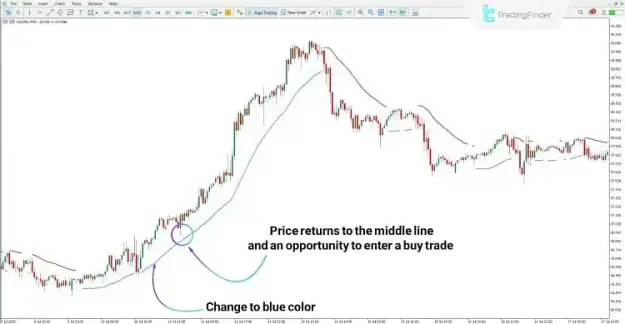
On the 30-minute chart of XAG/USD, a change in the indicator color to blue signals the emergence of a positive market trend.
As the trend develops, temporary pullbacks toward the indicator’s central level may provide strategic buying opportunities. If the market resumes its upward movement after testing this area, traders can use the confirmation as a potential long-entry signal.
Analyzing Upward Market Momentum
The blue trend line confirms that buyers remain in control and that bullish momentum continues to dominate the market structure.
Identifying Buy Opportunities
Potential long positions can be considered when:
- The indicator remains blue.
- Price retraces toward the trend line.
- Bullish confirmation appears near support.
- Upward momentum resumes after the pullback.
Bearish Trend Setup
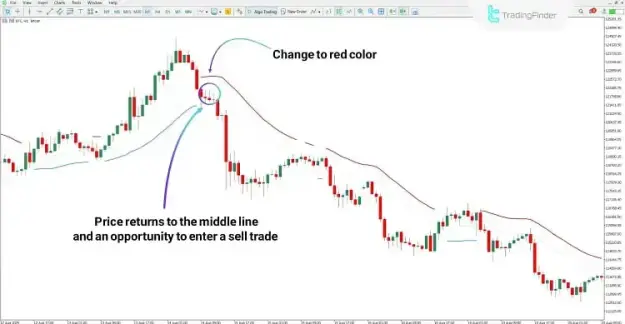
On the Bitcoin (BTC) 1-hour chart, the appearance of a red trend line indicates that sellers have gained control of market direction.
During bearish market conditions, corrective rallies toward the indicator’s central level may offer favorable opportunities for entering short positions.
Analyzing Downward Market Momentum
The red trend line confirms bearish dominance and helps traders recognize trend continuation patterns within declining markets.
Identifying Sell Opportunities
Potential short positions can be considered when:
- The indicator remains red.
- Price moves back toward the trend line.
- Bearish confirmation signals emerge.
- Selling momentum resumes following the retracement.
Trend Power Indicator Inputs
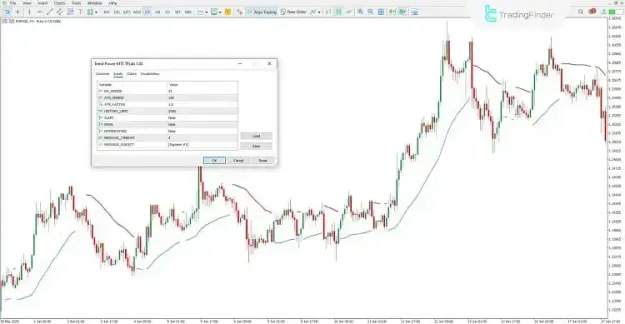
The Trend Power Indicator includes several customizable settings that allow traders to adapt its behavior to different market environments and trading preferences.
Available Parameters
- MA_PERIOD – Controls the Moving Average calculation length.
- ATR_PERIOD – Defines the Average True Range calculation period.
- ATR_FACTOR – Adjusts the ATR multiplier used by the indicator.
- ALERT – Enables or disables alert notifications.
- EMAIL – Sends trading alerts via email.
- NOTIFICATION – Activates mobile push notifications.
- MESSAGE_TIMEOUT – Sets the time interval between alerts.
- MESSAGE_SUBJECT – Customizes the title of alert messages.
Conclusion
The Trend Power Indicator is a versatile trend-analysis solution that combines the analytical power of Moving Averages with the volatility measurement capabilities of the Average True Range (ATR).
Its dynamic color-changing trend line helps traders recognize shifts in market direction, evaluate trend strength, and identify potential trade entries with greater confidence. Whether used for Forex, cryptocurrency, or stock trading, the indicator serves as a valuable tool for trend-following and reversal-based trading strategies.