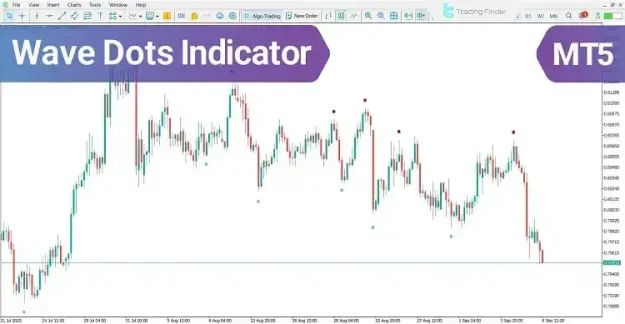


The indicator produces two types of reversal signals:
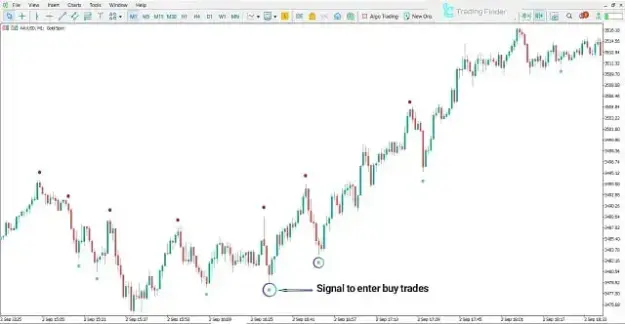
- Green Dot: Appears below the candles, suggesting that the market may be oversold and that bullish momentum could begin to develop.
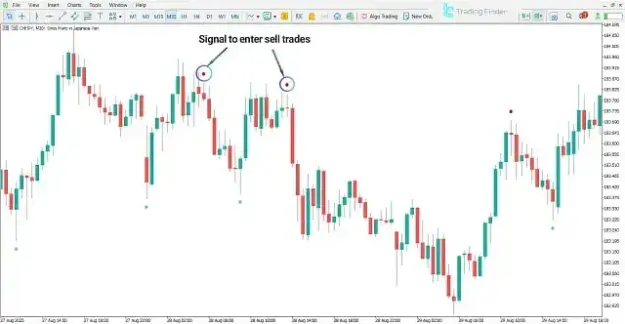
- Red Dot: Appears above the candles, indicating that the market may be overbought and that bearish pressure could increase.
These visual signals allow traders to quickly identify possible entry opportunities while monitoring changing market conditions.
 You can download it from this link:
https://cdn.tradingfinder.com/file/5...5-by-tflab.zip
 You can also access the MetaTrader 4 version of this Indicator through this page:
https://www.cryptocraft.com/thread/1...er-4-freetflab
 For instructions on how to install:
https://www.forexfactory.com/thread/...-in-metatrader
Prop Firm DrawDown Protector : Prop Firm Capital Protection Expert MT5 |Forex Money Management: Forex Trade Management Expert MT5 | ICT Concepts Indicator MT5 |Smart Money Concepts Expert MT5 | Smart Money Trap Scanner | Get a free Expert Advisor license via Telegram and WhatsApp
Wave Dots Indicator Features
Indicator Categories
- Signal & Forecast MT5 Indicator
- Trading Assistant MT5 Indicator
Platform
- MetaTrader 5
Experience Level
- Beginner
- Intermediate
- Professional
Indicator Type
- Trend Reversal Indicator
- Overbought & Oversold Indicator
Timeframe Support
- Multi-Timeframe
Trading Style
- Scalping
- Intraday Trading
- Swing Trading
Supported Markets
- Forex
- Cryptocurrencies
- Stocks
- Commodities
- Indices
How the Wave Dots Indicator Works
The Wave Dots Indicator continuously evaluates market momentum and searches for areas where the current trend begins to lose strength. Rather than displaying multiple oscillators or complex calculations, it presents its analysis through simple colored dots placed directly on the chart.
This streamlined approach enables traders to identify potential reversal zones more efficiently while maintaining a clean trading workspace. The indicator can be applied to various financial instruments and performs consistently across different chart timeframes.
Using the Wave Dots Indicator During Bullish Conditions
When selling momentum starts to weaken, the indicator may generate a green dot beneath the corresponding candle.
This signal suggests that the market has entered an oversold condition where buyers could gradually regain control.
A bullish signal may indicate:
- Reduced selling pressure.
- Possible exhaustion of the downtrend.
- Increasing probability of upward price movement.
- A potential buying opportunity after confirmation.
Many traders strengthen this signal by combining it with support levels, candlestick formations, or additional technical indicators before opening a long position.
Using the Wave Dots Indicator During Bearish Conditions
As buying momentum begins to fade, the indicator may display a red dot above the price candles.
This signal indicates that the market has reached an overbought condition where upward momentum could weaken, increasing the likelihood of a bearish correction.
A bearish signal may suggest:
- Overbought market conditions.
- Slowing bullish momentum.
- Increased probability of a downward reversal.
- A potential selling opportunity after confirmation.
To improve signal quality, traders often combine these alerts with resistance levels, trend analysis, or other momentum indicators.
Wave Dots Indicator Settings
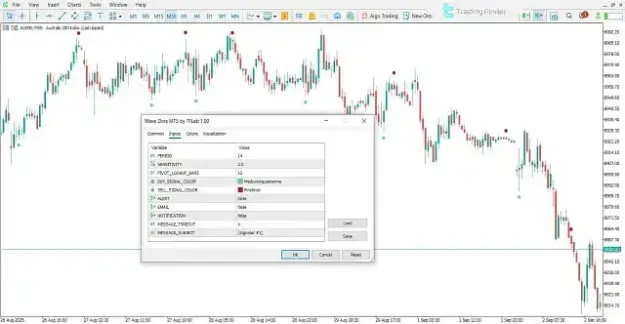
The indicator includes several adjustable parameters that allow traders to customize its behavior according to different trading strategies and market environments.
PERIOD
- Specifies the calculation period used by the indicator.
SENSITIVITY
- Adjusts the responsiveness of reversal detection.
PIVOT_LOOKUP_BARS
- Determines how many previous candles are analyzed when identifying pivot highs and lows.
BUY_SIGNAL_COLOR
- Defines the display color of bullish signals.
SELL_SIGNAL_COLOR
- Defines the display color of bearish signals.
ALERT
- Enables or disables on-screen alerts.
- Sends signal notifications via email.
NOTIFICATION
- Sends push notifications to the MetaTrader mobile application.
MESSAGE_TIMEOUT
- Controls how long alert messages remain visible.
MESSAGE_SUBJECT
- Sets the title displayed in notifications.
Benefits of the Wave Dots Indicator
The Wave Dots Indicator provides several advantages for traders looking for reliable reversal signals.
- Automatically detects potential market turning points.
- Generates clear bullish and bearish visual signals.
- Identifies overbought and oversold market conditions.
- Supports multiple asset classes and trading styles.
- Compatible with every MetaTrader 5 timeframe.
- Offers customizable sensitivity and alert settings.
- Includes desktop, email, and mobile notifications.
- Maintains a clean and easy-to-read chart layout.
Conclusion
The Wave Dots Indicator for MetaTrader 5 is designed to help traders identify possible market reversals by highlighting changes in price momentum with simple visual signals.
Green dots indicate areas where selling pressure may be exhausted, while red dots highlight zones where buying momentum could be weakening. By combining these signals with technical confirmation tools such as support and resistance, trend analysis, or candlestick patterns, traders can improve the quality of their market analysis and make more informed trading decisions across Forex, cryptocurrency, stock, commodity, and index markets.