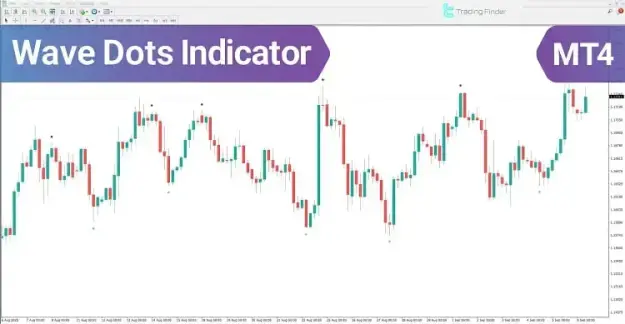


The indicator produces two primary signals:
- Green Dot: Appears beneath the candles, indicating oversold conditions and the possibility of an upward price reversal.
- Red Dot: Appears above the candles, indicating overbought conditions and the potential start of a downward movement.
Its clean visual presentation allows traders to interpret market conditions quickly without the need for complex technical analysis.
 You can download it from this link:
https://cdn.tradingfinder.com/file/5...4-by-tflab.zip
 For instructions on how to install:
https://www.forexfactory.com/thread/...-in-metatrader
Prop Firm DrawDown Protector : Prop Firm Capital Protection Expert MT4 | Forex Money Management: Forex Trade Management Expert MT4 |ICT Concepts Indicator MT4 | Smart Money Concepts Expert MT4| Smart Money Trap Scanner | Get a free Expert Advisor license via Telegram and WhatsApp
Wave Dots Indicator Specifications
Indicator Categories
- Signal & Forecast MT4 Indicators
- Trading Assist MT4 Indicators
Platform
- MetaTrader 4
Skill Level
- Beginner
Indicator Type
- Overbought and Oversold MT4 Indicators
- Reversal MT4 Indicators
Supported Timeframes
- Multi-Timeframe
Trading Style
- Intraday Trading
Supported Markets
- Forex
- Cryptocurrency
- Stock Market
Wave Dots Indicator Overview
The Wave Dots Indicator assists traders in recognizing potential trend reversals by marking important price levels directly on the trading chart. Instead of relying on multiple indicators to evaluate momentum, traders can use the colored dots to identify areas where buying or selling pressure may be reaching exhaustion.
By highlighting overbought and oversold conditions, the indicator helps traders monitor possible trend changes before significant price movements occur.
Key Benefits
- Generates visual buy and sell signals directly on the chart.
- Detects potential market reversal zones.
- Highlights overbought and oversold conditions.
- Suitable for both novice and experienced traders.
- Functions effectively across different financial markets and timeframes.
Wave Dots Indicator in an Uptrend
Bullish Entry Signal
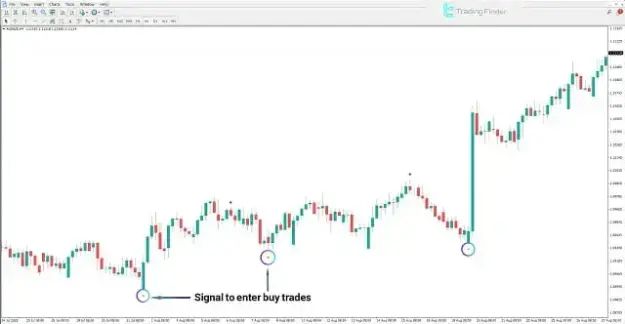
During bullish market conditions, temporary pullbacks may push prices into an oversold zone. When this happens, the indicator displays a green dot below the corresponding candle.
This signal suggests that bearish momentum may be weakening while buying interest begins to increase. Traders frequently use this indication to identify potential long positions after confirming the signal with additional technical analysis or price action.
The indicator is particularly effective for spotting continuation opportunities during healthy corrections within an existing uptrend.
Wave Dots Indicator in a Downtrend
Bearish Entry Signal
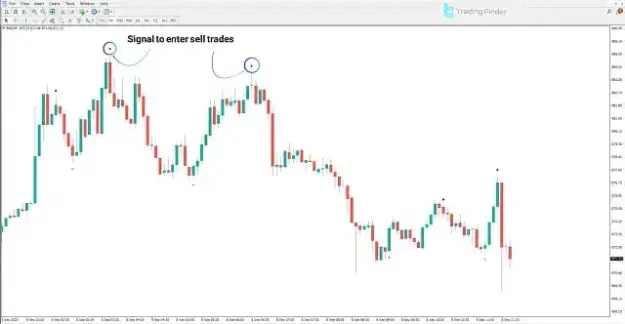
As buying pressure reaches extreme levels, the Wave Dots Indicator plots a red dot above the price candle.
This signal indicates that the market may have entered an overbought condition where upward momentum is beginning to lose strength. If selling activity increases, the market may enter a corrective phase or establish a new bearish trend.
Many traders use these signals to secure profits on buy positions or to identify favorable conditions for opening short trades.
Wave Dots Indicator Settings
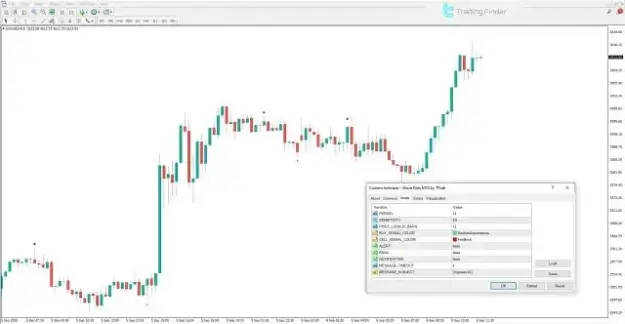
The indicator provides several customizable parameters that allow traders to adjust its behavior according to different market conditions and trading preferences.
Input Parameters
- PERIOD: Determines the calculation period of the indicator.
- SENSITIVITY: Adjusts the sensitivity of signal generation.
- PIVOT_LOOKUP_BARS: Sets the number of historical candles used to identify pivot points.
- BUY_SIGNAL_COLOR: Defines the display color for bullish signals.
- SELL_SIGNAL_COLOR: Defines the display color for bearish signals.
- ALERT: Enables on-screen signal alerts.
- EMAIL: Sends trading alerts via email.
- NOTIFICATION: Activates mobile push notifications.
- MESSAGE_TIMEOUT: Specifies the duration of alert messages.
- MESSAGE_SUBJECT: Sets the title for generated notifications.
Conclusion
The Wave Dots Indicator is a practical MT4 trading tool that simplifies the identification of trend reversal opportunities through clear visual signals. By displaying green dots below price candles and red dots above them, the indicator helps traders recognize oversold and overbought market conditions with greater confidence.
Its flexible settings, intuitive interface, and compatibility with Forex, cryptocurrency, and stock market trading make it a valuable addition to any technical trading strategy. Whether used as a standalone reversal indicator or combined with other analytical tools, the Wave Dots Indicator can improve trade timing and support more informed market decisions.