

By detecting momentum extremes, this indicator enables traders to align potential entry and exit decisions with the prevailing market direction and overall trading strategy.
 You can download it from this link:
https://cdn.tradingfinder.com/file/5...5-by-tflab.zip
 You can also access the MetaTrader 4 version of this Indicator through this page:
https://www.cryptocraft.com/thread/1...atrader-4-free
 For instructions on how to install:
https://www.forexfactory.com/thread/...-in-metatrader
Prop Firm DrawDown Protector : Prop Firm Capital Protection Expert MT5 |Forex Money Management: Forex Trade Management Expert MT5 | ICT Concepts Indicator MT5 |Smart Money Concepts Expert MT5 | Smart Money Trap Scanner | Get a free Expert Advisor license via Telegram and WhatsApp
RSI Overbought Oversold Indicator Specifications
The indicator offers a comprehensive set of features suitable for analyzing different asset classes and trading styles.
Indicator Categories
- Currency Strength MT5 Indicators
- Trading Assistance MT5 Indicators
Platform Compatibility
- MetaTrader 5 (MT5)
Required Trading Experience
- Beginner Traders
- Intermediate Traders
Indicator Classification
- Overbought and Oversold Indicators
- Trend Reversal Indicators
Supported Timeframes
- Multi-Timeframe Trading Analysis
Suitable Trading Approaches
- Day Trading
- Scalping
- Swing Trading
Applicable Markets
- Forex Market
- Cryptocurrency Market
- Stock Market
Overview of the RSI Overbought Oversold Indicator
The indicator continuously evaluates RSI readings and identifies situations where buying or selling pressure may have reached extreme levels.
The generated signals are displayed as follows:
- Blue arrows highlight oversold conditions.
- Red arrows highlight overbought conditions.
These visual indications allow traders to quickly recognize potential turning points and assess possible market reversals without conducting extensive manual analysis.
Bullish Market Conditions
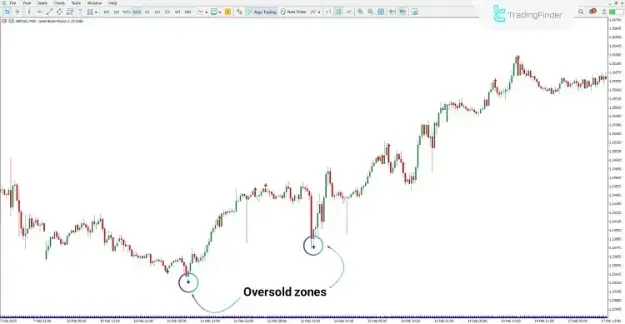
On the GBP/USD M30 chart, the indicator identified multiple oversold areas and marked them with blue arrows below the candlesticks.
When the broader market trend remains bullish, these oversold signals can be interpreted as potential opportunities to enter long positions and participate in the continuation of upward momentum.
Using the Indicator During an Uptrend
In rising markets, short-term corrections often create temporary oversold conditions. The indicator helps traders identify these retracement areas and locate favorable buying zones that align with the dominant trend direction.
Bearish Market Conditions
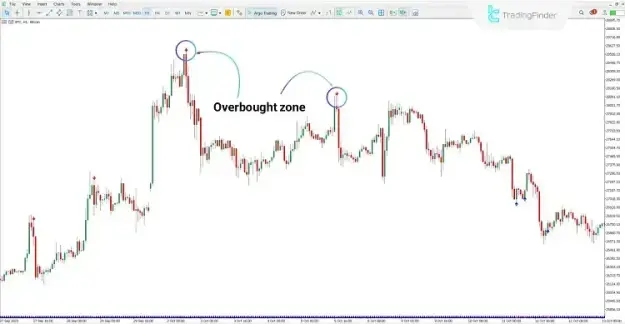
On the BTC/USD H1 chart, the indicator detected overbought conditions and displayed red arrows above the price action.
Under bearish market conditions, overbought signals may indicate weakening bullish momentum and the possibility of an upcoming downward movement.
Using the Indicator During a Downtrend
The indicator assists traders in finding potential short-selling opportunities by highlighting areas where market prices may have become excessively overbought before a bearish correction or reversal.
RSI Overbought Oversold Indicator Settings
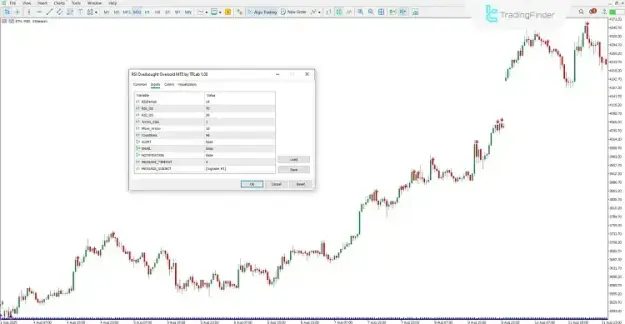
The RSI Overbought Oversold Indicator includes a variety of configurable settings that allow traders to customize signal generation and notification behavior.
Input Parameters
- RSIPeriod: Defines the RSI calculation length.
- RSI_OB: Specifies the overbought threshold value.
- RSI_OS: Specifies the oversold threshold value.
- Arrow_Size: Determines the size of signal arrows displayed on the chart.
- Move_Arrow: Adjusts the spacing between arrows and price candles.
- CountBars: Sets the number of historical bars included in the analysis.
- ALERT: Enables visual alert notifications.
- EMAIL: Sends alerts through email.
- NOTIFICATION: Activates push notification alerts.
- MESSAGE_TIMEOUT: Determines the interval between alert messages.
- MESSAGE_SUBJECT: Defines the title of generated alerts.
Benefits of the RSI Overbought Oversold Indicator
Key Features and Advantages
- Detects overbought and oversold market conditions automatically.
- Displays intuitive visual signals through colored arrows.
- Assists in identifying potential trend reversal zones.
- Compatible with multiple trading styles and market conditions.
- Supports Forex, cryptocurrency, and stock market analysis.
- Provides customizable alert and notification functions.
- Simplifies technical analysis for traders of all experience levels.
- Improves trade timing when used alongside trend confirmation techniques.
Conclusion
The RSI Overbought Oversold Indicator is a practical MT5 technical analysis tool that leverages RSI calculations to identify potential market extremes. By marking overbought and oversold areas with clear visual signals, it helps traders detect possible reversal zones and evaluate trading opportunities with greater confidence.
When integrated with trend analysis, price action techniques, and disciplined risk management, the indicator can become a valuable component of a comprehensive trading strategy across multiple financial markets.