

This indicator is particularly useful for breakout traders who prefer to enter the market after price escapes a consolidation range and begins forming a sustainable trend.
 You can download it from this link:
https://cdn.tradingfinder.com/file/5...5-by-tflab.zip
 You can also access the MetaTrader 4 version of this Indicator through this page:
https://www.cryptocraft.com/thread/1...n-metatrader-4
 For instructions on how to install:
https://www.forexfactory.com/thread/...-in-metatrader
Prop Firm DrawDown Protector : Prop Firm Capital Protection Expert MT5 |Forex Money Management: Forex Trade Management Expert MT5 | ICT Concepts Indicator MT5 |Smart Money Concepts Expert MT5 | Smart Money Trap Scanner | Get a free Expert Advisor license via Telegram and WhatsApp
Flat Market Indicator Specifications
Indicator Classification
- Oscillator-Based Indicator
- Currency Strength Analysis Tool
- Trading Assistance Indicator
Supported Trading Platform
- MetaTrader 5 (MT5)
User Experience Level
- Beginner
- Intermediate
- Advanced
Indicator Functionality
- Range Detection
- Trend Identification
- Market Condition Analysis
Timeframe Support
- Multi-Timeframe Compatible
Trading Approaches
- Scalping
- Intraday Trading
- Day Trading
Supported Markets
- Forex
- Cryptocurrencies
- Stocks
- Indices
- Share CFDs
Flat Market Indicator Overview
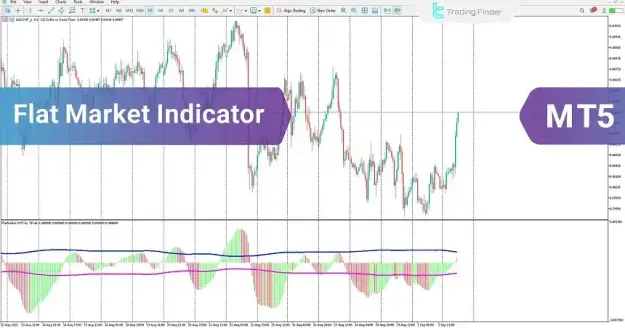
The Flat Market Indicator is designed to determine whether the market is experiencing consolidation or transitioning into a trending environment.
Its histogram oscillates between two calculated levels that define the range zone. When the histogram remains inside these boundaries, market conditions are considered neutral. Once the histogram breaks beyond either limit, the indicator suggests that momentum is increasing and a new trend may be underway.
Key signal interpretations include:
- Histogram between both levels indicates market consolidation
- Histogram above the upper level suggests bullish market pressure
- Histogram below the lower level suggests bearish market pressure
- Breakouts from the range zone may indicate trend formation
This functionality allows traders to avoid entering positions during uncertain market conditions and focus on stronger directional opportunities.
Bullish Trend Analysis
Recognizing a Buy Setup
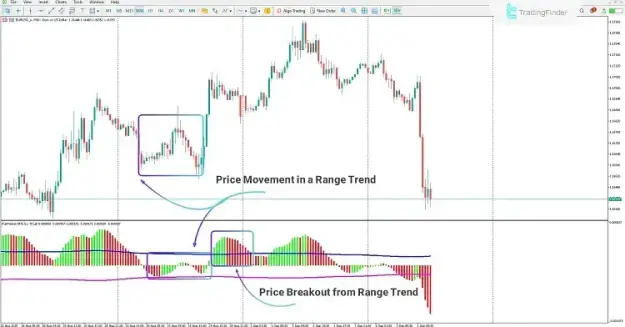
The Flat Market Indicator can help traders identify the transition from a sideways market into a bullish trend.
On a EUR/USD 30-minute chart, the histogram may remain confined between the oscillator boundaries while the market consolidates. As buying pressure strengthens, the histogram can break above the upper boundary, signaling the possibility of an emerging uptrend.
Characteristics of bullish market conditions include:
- Histogram breakout above the upper boundary
- Strengthening buyer participation
- Shift from consolidation to upward momentum
- Potential long-entry opportunity
These signals may indicate that buyers are gaining control and a new upward trend is developing.
Bearish Trend Analysis
Recognizing a Sell Setup
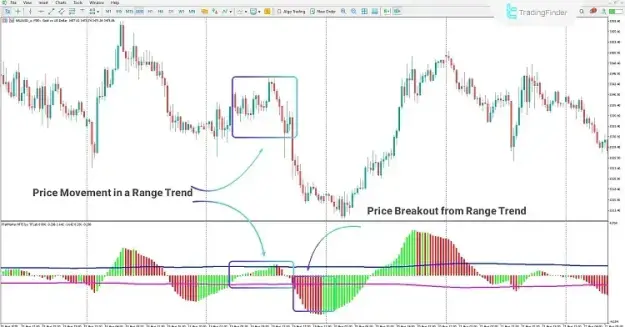
The indicator can also identify bearish market transitions after prolonged periods of ranging activity.
On a Gold (XAU/USD) 30-minute chart, the histogram may remain within the defined range zone while price moves sideways. When selling pressure increases and the histogram drops below the lower boundary, the indicator highlights the potential beginning of a bearish trend.
Characteristics of bearish market conditions include:
- Histogram breakout below the lower boundary
- Increasing selling activity
- Breakdown of consolidation structure
- Potential short-entry opportunity
These conditions may indicate that sellers are taking control of market direction.
Flat Market Indicator Settings
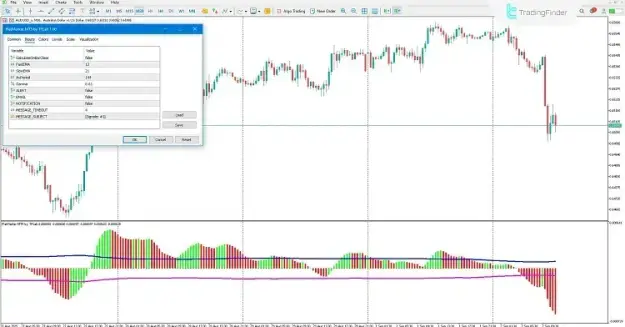
The Flat Market Indicator includes several customizable parameters that allow traders to adjust sensitivity levels and notification preferences.
Calculate On Bar Close
- Uses candle closing prices for calculations when enabled.
- Uses median price calculations when disabled.
Fast EMA
- Sets the calculation period of the short-term exponential moving average.
Slow EMA
- Sets the calculation period of the long-term exponential moving average.
Av Period
- Determines the averaging length used for range calculations.
- Higher values generate smoother and more stable signals.
Gamma
- Controls the width of the oscillator range zone.
- Larger values create wider consolidation boundaries.
- Smaller values generate earlier breakout notifications.
ALERT
- Enables chart alerts when breakout conditions occur.
- Sends email notifications when the histogram exits the range zone.
NOTIFICATION
- Activates push notifications for mobile devices and trading terminals.
MESSAGE_TIMEOUT
- Defines the minimum interval between alert messages.
MESSAGE_SUBJECT
- Allows customization of notification titles and email subjects.
Benefits of the Flat Market Indicator
- Identifies consolidation and breakout phases
- Helps traders avoid low-probability ranging markets
- Detects emerging bullish and bearish trends
- Provides visual confirmation of momentum shifts
- Supports multiple asset classes and timeframes
- Includes advanced alert and notification features
- Enhances breakout trading strategies
- Integrates easily with existing technical analysis methods
Conclusion
The Flat Market Indicator for MetaTrader 5 is a practical solution for traders who want to identify range-bound markets and anticipate trend development. By combining a histogram with adaptive oscillator boundaries, the indicator offers a clear method for recognizing shifts in market momentum.
When used alongside technical analysis and disciplined risk management, the Flat Market Indicator can help traders improve market timing, enhance trend recognition, and uncover trading opportunities across a broad range of financial instruments.