This indicator uses blue and red histogram bars to represent bullish and bearish market conditions, while also displaying trend strength percentage directly on the chart for more precise market analysis.
https://cdn.tradingfinder.com/file/5...4-by-tflab.zip
https://www.forexfactory.com/thread/...-in-metatrader
Prop Firm DrawDown Protector : Prop Firm Capital Protection Expert MT4 | Forex Money Management: Forex Trade Management Expert MT4 |ICT Concepts Indicator MT4 | Smart Money Concepts Expert MT4| Smart Money Trap Scanner | Get a free Expert Advisor license via Telegram and WhatsApp
Core Features of the Trend Striker Extreme Indicator
The indicator combines technical analysis tools with trading assistance features to support decision-making in different market conditions.
Primary Features
- Detects bullish and bearish market trends
- Displays real-time trend strength percentage
- Generates automatic buy and sell signals
- Uses blue histogram bars for upward momentum
- Uses red histogram bars for downward momentum
- Supports multiple timeframe analysis
- Includes customizable alert systems
- Works across Forex, crypto, and stock markets
Supported Trading Styles
This indicator can be used in different trading strategies, including:
- Day trading
- Scalping strategies
- Swing trading
- Intraday trading
Supported Financial Markets
The Trend Striker Extreme Indicator is suitable for multiple asset classes:
- Forex currency pairs
- Cryptocurrency markets
- Stock market instruments
- CFD trading assets
Trend Striker Extreme Indicator Overview
The indicator simplifies trend analysis by combining momentum detection with signal generation in a single system.
It continuously analyzes price action using fast and slow periods and displays the results through histogram bars and percentage-based trend strength on the chart.
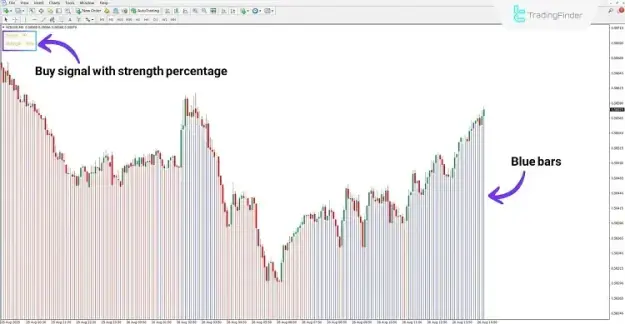
Bullish Market Conditions
When the market is in an upward trend, the indicator displays blue histogram bars.
Key Bullish Signals
- Continuous blue histogram bars
- Increasing trend strength percentage
- Buy signal alerts on the chart
- Confirmation of upward momentum
For example, on the NZD/USD 5-minute chart, the indicator may generate a buy signal after detecting strong bullish momentum.
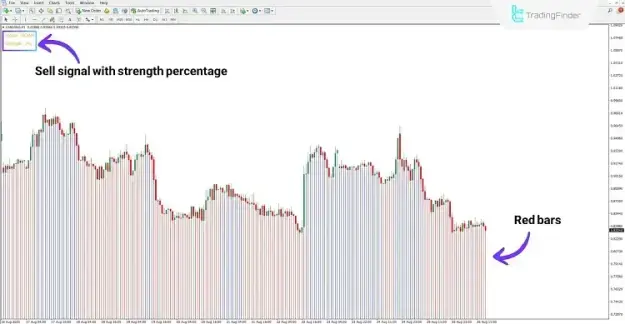
Bearish Market Conditions
When the market moves downward, red histogram bars appear on the chart.
Key Bearish Signals
- Red histogram bars dominate the chart
- Decreasing market momentum
- Sell signal generation
- Strong bearish trend confirmation
For example, on ADA/USD (1-hour timeframe), the indicator can detect bearish conditions and issue sell signals along with trend strength data.
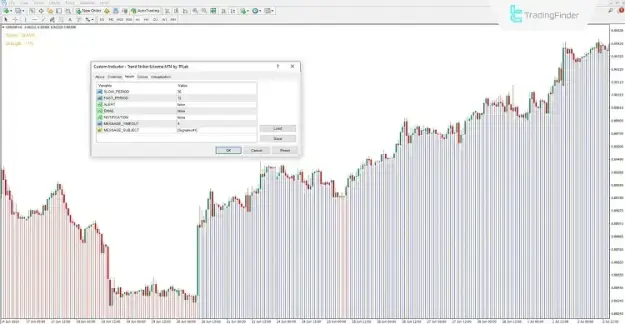
Trend Striker Extreme Indicator Settings
The indicator includes adjustable parameters for customization based on trading strategy and timeframe.
Adjustable Parameters
SLOW_PERIOD
Defines the longer-term trend calculation period.
FAST_PERIOD
Defines the short-term momentum calculation period.
ALERT
Enables alerts when trading signals change.
EMAIL
Sends signals directly to email.
NOTIFICATION
Activates push notifications for alerts.
MESSAGE_TIMEOUT
Controls how long signal messages appear on the chart.
MESSAGE_SUBJECT
Sets the title for signal notifications.
Advantages of the Trend Striker Extreme Indicator
The indicator offers several benefits for traders seeking reliable trend confirmation tools.
Key Advantages
- Simple and clear visual interface
- Accurate trend direction detection
- Real-time momentum analysis
- Suitable for beginners and professionals
- Works across multiple markets
- Automatic buy/sell signal generation
- Flexible and customizable settings
Conclusion
The Trend Striker Extreme Indicator is a powerful technical analysis tool designed for the MetaTrader 4 platform.
By combining histogram-based trend visualization, percentage strength measurement, and automated trading signals, it provides traders with a structured and efficient approach to market analysis across Forex, cryptocurrency, and stock markets.