

 You can download it from this link:
https://cdn.tradingfinder.com/file/5...5-by-tflab.zip
 You can also access the MetaTrader 4 version of this Indicator through this page:
https://www.cryptocraft.com/thread/1...-mt4free-tflab
 For instructions on how to install:
https://www.forexfactory.com/thread/...-in-metatrader
Prop Firm DrawDown Protector : Prop Firm Capital Protection Expert MT5 |Forex Money Management: Forex Trade Management Expert MT5 | ICT Concepts Indicator MT5 |Smart Money Concepts Expert MT5 | Smart Money Trap Scanner | Get a free Expert Advisor license via Telegram and WhatsApp
Indicator Overview and Core Mechanism
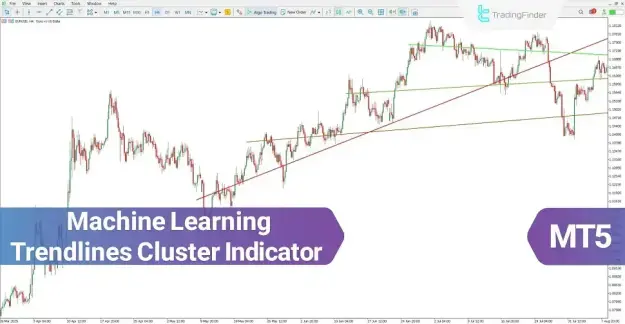
The Machine Learning Trendlines Clustering Indicator functions by grouping historical price data through clustering algorithms. These clusters represent areas of similar market behavior or price levels. A linear regression model is then applied to each cluster to generate structured and precise trendlines.
This data-driven methodology significantly enhances the accuracy of identifying support and resistance levels compared to conventional manual approaches.
Key Features and Technical Capabilities
This indicator is widely adopted by advanced traders due to its integration of machine learning with price action strategies.
- Integrates machine learning algorithms with technical analysis
- Groups similar price movements using clustering techniques
- Applies linear regression for precise trendline construction
- Effective for identifying breakout and reversal signals
- Supports multi-timeframe analysis for comprehensive insights
- Suitable for multiple trading styles:
- Scalping
- Day trading
- Swing trading
- Applicable across various financial instruments:
- Forex markets
- Cryptocurrencies
- Stocks
Machine Learning Trendlines Clustering Indicator at a Glance
This indicator automatically detects and plots valid trendlines by analyzing clustered price data. It highlights key reaction zones and defines support and resistance levels based on recurring market behavior.
Uptrend Analysis
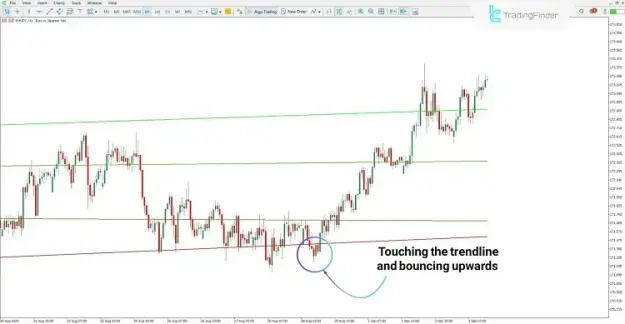
In bullish market conditions, the indicator identifies ascending trendlines that function as dynamic support.
- Price reacts upward after contacting the trendline
- Support levels are derived from clustered price zones
- Repeated rebounds confirm the strength of the uptrend
These signals indicate potential continuation of bullish momentum and favorable buy opportunities.
Downtrend Analysis
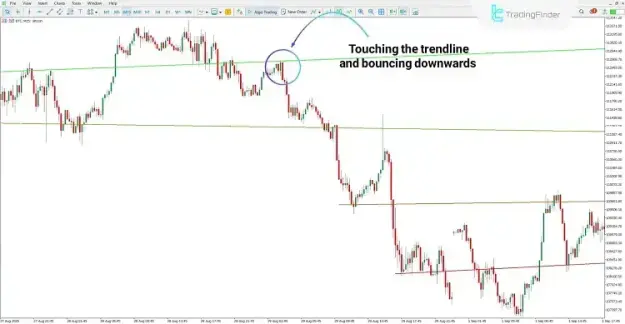
In bearish conditions, the indicator plots descending trendlines that act as resistance levels.
- Price is rejected upon reaching the trendline
- Resistance zones are defined by clustered data points
- Downward movement follows interaction with resistance
These patterns highlight potential sell opportunities and continuation of the downtrend.
Indicator Settings and Customization
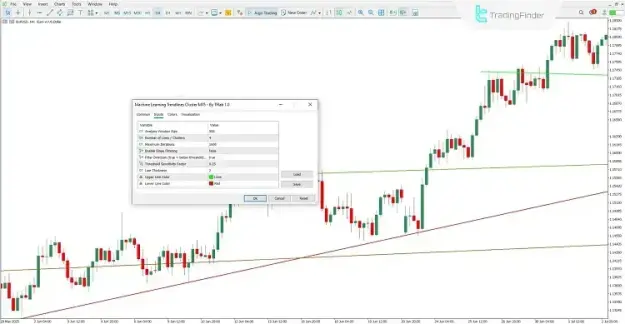
The Machine Learning Trendlines Clustering Indicator offers flexible configuration options to suit different trading strategies and market environments.
- Analysis Window Size: Specifies the number of candles included in the analysis
- Number of Lines / Clusters: Determines the number of generated trendlines or clusters
- Maximum Iterations: Sets the maximum number of algorithm processing cycles
- Enable Slope Filtering: Activates filtering based on trendline slope
- Filter Direction: Defines whether filtering is applied above or below a threshold
- Threshold Sensitivity Factor: Adjusts the sensitivity of filtering conditions
- Line Thickness: Controls the visual thickness of trendlines
- Upper Line Color: Sets the color for resistance lines
- Lower Line Color: Sets the color for support lines
Conclusion
The Machine Learning Trendlines Clustering Indicator is a powerful analytical tool that enhances traditional technical analysis through the integration of clustering algorithms and linear regression techniques.
By grouping similar price movements and automatically generating structured trendlines, it delivers accurate and reliable support and resistance levels. This makes it an effective solution for identifying breakout opportunities, trend continuations, and market reversals across multiple financial markets.