By providing clear entry and exit signals through labeled patterns and directional markers, the indicator improves decision-making efficiency in fast-moving market conditions.
https://cdn.tradingfinder.com/file/5...4-by-tflab.zip
https://www.forexfactory.com/thread/...-in-metatrader
Prop Firm DrawDown Protector : Prop Firm Capital Protection Expert MT4 | Forex Money Management: Forex Trade Management Expert MT4 |ICT Concepts Indicator MT4 | Smart Money Concepts Expert MT4| Smart Money Trap Scanner | Get a free Expert Advisor license via Telegram and WhatsApp
Key Functions and Market Application
The main function of this indicator is to detect structured price action setups and convert them into actionable trading signals. Once a valid formation appears, the tool automatically places a label on the chart showing the pattern name along with a corresponding buy or sell indication.
This allows traders to interpret market structure quickly without the need for manual candlestick analysis.
Bullish and Bearish Pattern Recognition
The indicator classifies market behavior into bullish and bearish patterns based on price action context.
Bullish Patterns
- DBLHC: Signals potential upward continuation or reversal
- TMLTB: Indicates support confirmation and possible bullish expansion
- Bullish Pin Bar: Reflects rejection of lower prices and possible upside reversal
- BUOVB: Strong continuation signal in an upward trend
Bearish Patterns
- DBHLC: Suggests possible downward pressure and reversal
- TMHTB: Indicates resistance formation and potential bearish reaction
- Bearish Pin Bar: Reflects rejection of higher prices and possible downside movement
- BEOVB: Strong continuation signal supporting further decline
- IB4: Represents market compression and potential breakout conditions
Trend Conditions and Trading Signals
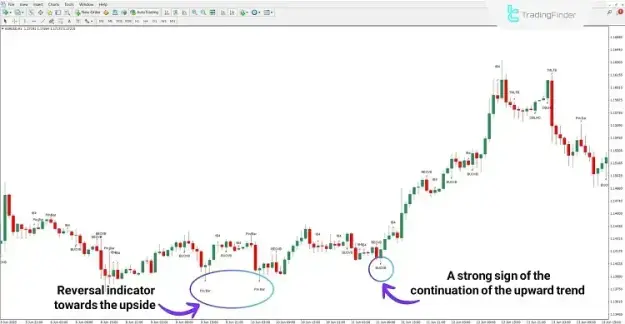
Uptrend and Buy Signals
During bullish market conditions, particularly across different timeframes such as EUR/USD, the indicator may generate multiple aligned bullish signals including Pin Bar and BUOVB patterns.
These formations typically reflect strong buying pressure, trend continuation, or the start of a new upward movement following a correction phase.
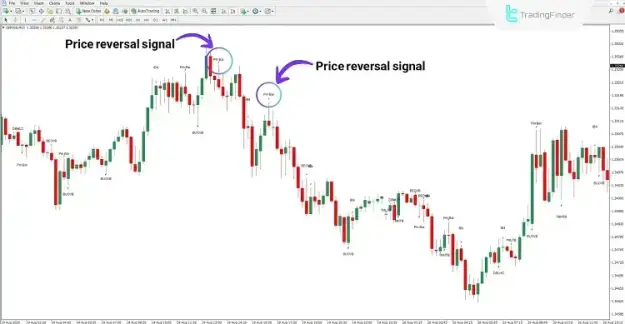
Downtrend and Sell Signals
In bearish conditions, such as observed on GBP/USD lower timeframes, reversal patterns like the Bearish Pin Bar often appear near market highs.
These signals may indicate trend exhaustion and the beginning of downward momentum, creating potential selling opportunities in alignment with overall market structure.
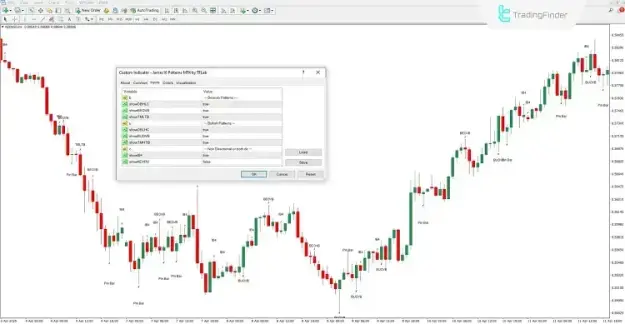
Indicator Settings and Customization
The James16 Patterns Indicator offers flexible configuration options, allowing traders to enable or disable specific pattern types based on their strategy.
Bearish Pattern Options
- showDBHLC: Double Bar High Lower Close
- showBEOVB: Bearish Outside Vertical Bar
- showTMLTB: Two Matching Low Bars
Bullish Pattern Options
- showDBLHC: Double Bar Low Higher Close
- showBUOVB: Bullish Outside Vertical Bar
- showTMHTB: Two Matching High Bars
Neutral and Reversal Patterns
- showIB4: Inside Bar 4 pattern
- showKEYRV: Key reversal formations
This customization allows traders to filter signals and focus only on the most relevant setups for their trading approach.
Conclusion
The James16 Patterns Indicator is a practical price action tool for MetaTrader 4 that simplifies the process of identifying high-probability trading opportunities. By automatically detecting bullish and bearish formations and displaying them directly on the chart, it enhances trading efficiency and reduces the need for manual analysis.
Its combination of pattern recognition, visual signaling, and customizable settings makes it suitable for various trading styles, including scalping, day trading, and swing trading across multiple financial markets such as forex, stocks, indices, commodities, and cryptocurrencies.