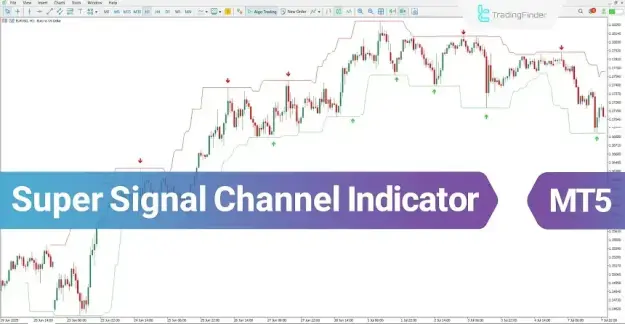
Alongside signal generation, this indicator builds a dynamic price channel using two colored boundary lines. This structure provides traders with a clear and organized visual representation of market movement, supporting more informed trading decisions.
https://cdn.tradingfinder.com/file/5...5-by-tflab.zip
https://www.cryptocraft.com/thread/1...icator-for-mt4
https://www.forexfactory.com/thread/...-in-metatrader
Prop Firm DrawDown Protector : Prop Firm Capital Protection Expert MT5 |Forex Money Management: Forex Trade Management Expert MT5 | ICT Concepts Indicator MT5 |Smart Money Concepts Expert MT5 | Smart Money Trap Scanner | Get a free Expert Advisor license via Telegram and WhatsApp
Key Features of the Super Signal Channel Indicator
Indicator Classification
- Signal & Forecast Indicator
- Bands & Channels Indicator
- Levels Indicator
Platform Compatibility
- MetaTrader 5 (MT5)
Skill Requirement
- Appropriate for beginner traders
Indicator Type
- Reversal Indicator
Timeframe Support
- Multi-timeframe capability
Trading Styles
- Swing Trading
- Scalping
- Day Trading
Supported Markets
- Forex
- Cryptocurrency
- Equities
Indicator Functionality Overview
The Super Signal Channel Indicator enhances chart analysis by providing clear visual markers for trading opportunities:
- Green arrows highlight potential buy entries
- Red arrows indicate possible sell setups
- Dynamic channel lines (green and red) outline price boundaries and reflect market volatility
These components collectively enable traders to assess market direction with greater clarity and confidence.
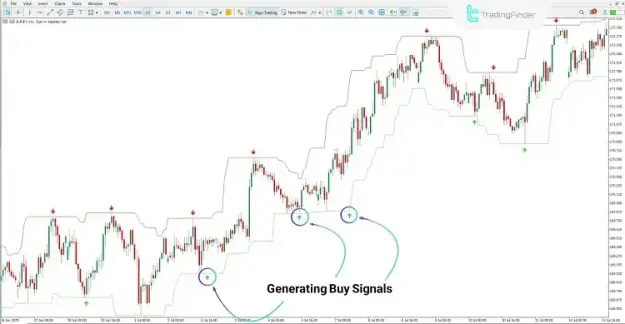
Buy Signal Strategy
Identifying Bullish Setups
For instance, on the EUR/JPY pair in the 1-hour timeframe, the formation of green arrows signals potential buying opportunities.
- Open buy positions in accordance with the prevailing trend
- Place stop-loss orders below the lower channel (green line)
- Validate signals using additional technical indicators to improve accuracy
Uptrend Assessment
The indicator helps detect sustained bullish trends by keeping price movement within the channel structure, allowing traders to identify optimal entry zones.
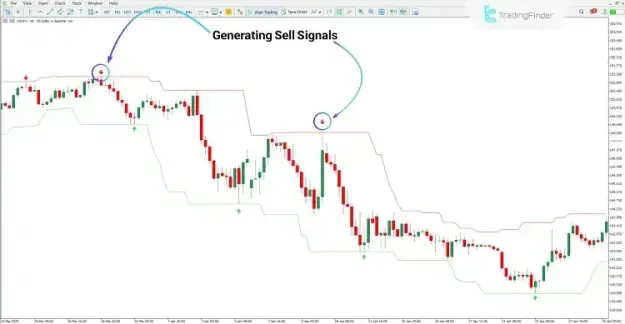
Sell Signal Strategy
Recognizing Bearish Opportunities
In cases such as the USD/JPY pair on the 4-hour timeframe, red arrows indicate potential selling conditions.
- Execute sell trades after confirming a downward trend
- Set stop-loss levels above the upper channel boundary
- Observe price interaction with channel lines to confirm trend continuation
Downtrend Evaluation
The indicator strengthens bearish analysis by marking reversal points and continuation patterns within declining market conditions.
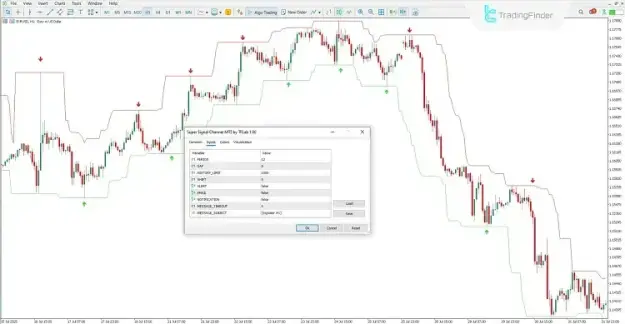
Indicator Settings and Configuration
The Super Signal Channel Indicator offers customizable parameters for performance optimization:
- PERIOD: Determines the calculation period length
- GAP: Adjusts the distance between price and channel lines
- HISTORY_LIMIT: Sets the number of historical candles used for analysis
- SHIFT: Controls the horizontal displacement of signals
- ALERT: Activates or deactivates alerts
- EMAIL: Enables email notifications
- NOTIFICATION: Manages push notification alerts
- MESSAGE_TIMEOUT: Defines the interval between alerts
- MESSAGE_SUBJECT: Specifies the alert title
Conclusion
The Super Signal Channel Indicator is an effective tool for detecting market reversals and refining trade entry and exit strategies. By combining visual signal markers with adaptive channel boundaries, it delivers a structured approach to analyzing price movements.
To achieve optimal results, traders are advised to integrate this indicator with additional technical analysis methods, thereby increasing the reliability and consistency of trading performance.