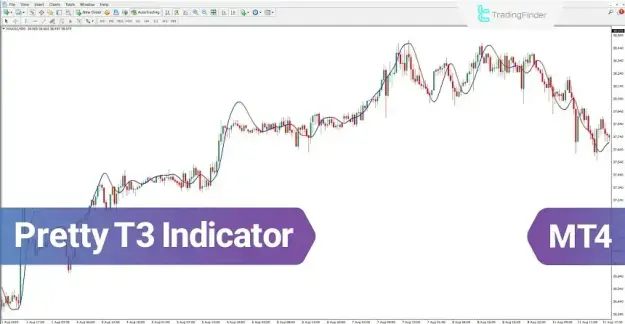


The indicator is built on a Moving Average (MA) framework, which visually illustrates market trend changes in real time. Beyond trend detection, the Moving Average line also acts as a dynamic support and resistance level, where price reactions frequently occur.
 You can download it from this link:
https://cdn.tradingfinder.com/file/5...4-by-tflab.zip
 You can also access the MetaTrader 5 version of this Indicator through this page:
https://www.cryptocraft.com/thread/1...atrader-5-free
 For instructions on how to install:
https://www.forexfactory.com/thread/...-in-metatrader
Prop Firm DrawDown Protector : Prop Firm Capital Protection Expert MT4 | Forex Money Management: Forex Trade Management Expert MT4 |ICT Concepts Indicator MT4 | Smart Money Concepts Expert MT4| Smart Money Trap Scanner | Get a free Expert Advisor license via Telegram and WhatsApp
Pretty T3 Indicator Specifications and Functional Overview
The Pretty T3 Indicator is categorized across several technical groups, making it adaptable to various trading environments and strategies:
- Indicator Categories:
- Signal & Forecast MT4 Indicators
- Volatility MT4 Indicators
- Levels MT4 Indicators
- Platform:
- MetaTrader 4 (MT4)
- Skill Level:
- Elementary
- Indicator Type:
- Reversal MT4 Indicators
- Timeframe Compatibility:
- Multi-Timeframe MT4 Indicators
- Trading Styles:
- Day Trading
- Scalping
- Swing Trading
- Trading Instruments:
- Forex
- Cryptocurrencies
- Commodities
- Indices
- Stocks
Pretty T3 Indicator Core Logic and Market Behavior
The calculation logic of the Pretty T3 Indicator is based on the Typical Price, which is derived from the average of the High, Low, and Close prices of each candlestick.
Market direction is displayed through a simple color-coded signal system:
- Blue line indicates bullish market conditions
- Red line indicates bearish market conditions
Bullish Trend Conditions
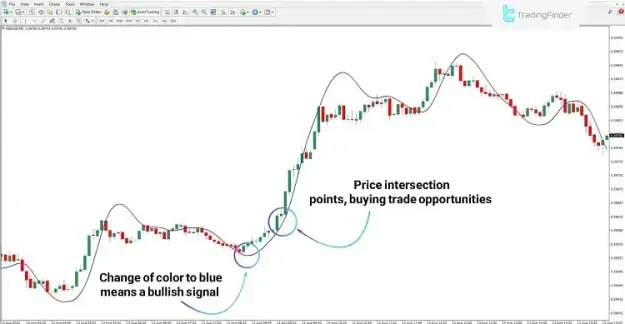
A transition from red to blue signals the possible beginning of an upward market trend.
In this situation:
- Price interaction with the signal line may represent potential buy opportunities
- Pullbacks toward the line can serve as possible long entry zones
- Example reference: NZD/USD on the 5-minute timeframe
This structure allows traders to identify early bullish momentum and improve entry timing.
Bearish Trend Conditions
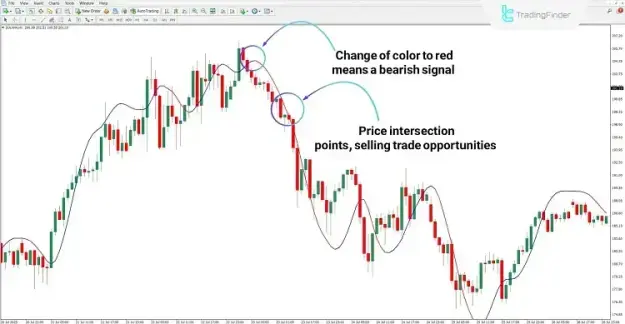
A transition from blue to red signals the potential start of a downward market trend.
In this condition:
- Price touches aligned with the signal direction may represent sell opportunities
- Trading decisions should follow bearish momentum confirmation
- Example reference: Solana (SOL) on the 1-hour timeframe
This mechanism helps traders recognize downward trend development and adjust their positions accordingly.
Pretty T3 Indicator Settings and Parameters
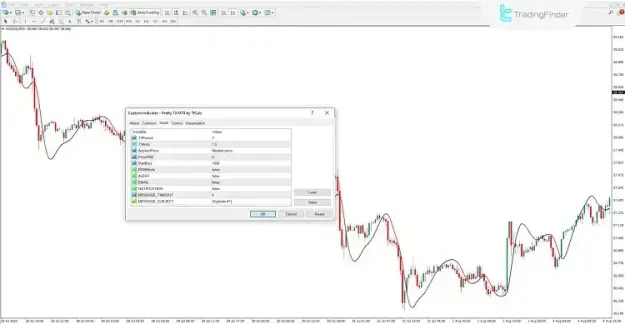
The indicator provides multiple configurable settings to optimize performance based on trading strategies and market conditions:
- T3Period: Defines the calculation period
- T3Amp: Controls smoothing strength
- AppliedPrice: Selects the applied price type
- PriceShift: Adjusts indicator positioning on the chart
- MaxBars: Sets the number of candles used in calculations
- RGBMode: Enables dynamic color switching
- ALERT: Activates alert notifications
- EMAIL: Enables email alerts
- NOTIFICATION: Enables push notifications
- MESSAGE_TIMEOUT: Defines time interval between alerts
- MESSAGE_SUBJECT: Sets alert title
Conclusion
The Pretty T3 Indicator combines Moving Average methodology with advanced smoothing techniques to present a clean and structured view of market trends.
Its key advantages include:
- Clear trend direction identification through color transitions
- Dynamic support and resistance functionality
- Reliable detection of potential entry and exit points
Overall, it provides traders with a simplified yet effective framework for analyzing price action across multiple markets and timeframes.