Within this indicator, a candlestick is defined as an Inside Bar when its full price range remains within the high and low of the previous candle. In contrast, a candlestick is recognized as an Outside Bar when it exceeds the range of the prior candle by forming either a higher high or a lower low.
To simplify visual analysis, the indicator marks Inside Bars with blue color and Outside Bars with red color, allowing traders to quickly identify these patterns under various market conditions.
https://cdn.tradingfinder.com/file/5...5-by-tflab.zip
https://www.cryptocraft.com/thread/1...atrader-4-free
https://www.forexfactory.com/thread/...-in-metatrader
Prop Firm DrawDown Protector : Prop Firm Capital Protection Expert MT5 |Forex Money Management: Forex Trade Management Expert MT5 | ICT Concepts Indicator MT5 |Smart Money Concepts Expert MT5 | Smart Money Trap Scanner | Get a free Expert Advisor license via Telegram and WhatsApp
Specifications – Inside Outside Bar Indicator
The following points describe the key features and classification of the Inside Outside Bar Indicator.
Indicator Categories
- Price Action MT5 Indicators
- Trading Assist MT5 Indicators
- Candlestick Pattern MT5 Indicators
Platform Compatibility
- MetaTrader 5 (MT5)
Required Trading Skill
- Beginner to Elementary level
Indicator Type
- Reversal Indicator
Timeframe Compatibility
- Multi-Timeframe Support
Trading Styles
- Swing Trading
- Scalping
- Day Trading
Supported Trading Instruments
- Forex market
- Cryptocurrency market
- Stock market
Inside Outside Bar Indicator Overview
The Inside Outside Bar Indicator is mainly used to help traders determine market direction while identifying important support and resistance areas.
In trending market environments, Inside Bars typically represent short consolidation phases. During this period, price temporarily pauses and accumulates momentum before continuing in the dominant direction. These formations often reflect lower volatility and a temporary balance between buyers and sellers.
Conversely, Outside Bars usually indicate strong price momentum. They frequently appear during periods of increased volatility and can signal either the continuation of the current trend or the start of a new directional move.
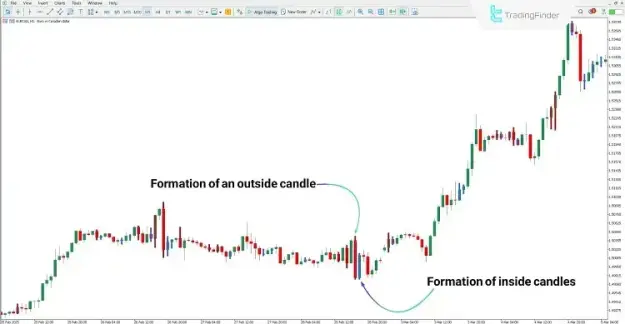
Bullish Trend Conditions
According to the EUR/USD 1-hour chart, the emergence of an Outside Bar near a key support zone may signal the potential beginning of a bullish movement.
Following this momentum, the formation of several Inside Bars may represent a consolidation phase within the trend. This period of consolidation often confirms the strength and stability of the bullish trend, allowing the market to gather energy before continuing toward higher price levels.
Bullish Trend Interpretation
- An Outside Bar forming near support can indicate bullish momentum.
- Multiple Inside Bars suggest consolidation within the trend.
- The combination of these formations may support the continuation of an upward movement.
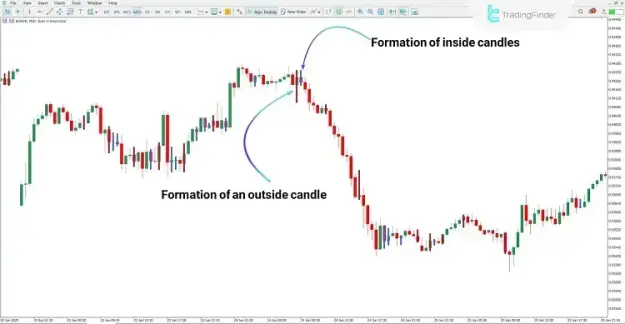
Bearish Trend Conditions
Based on the EUR/CHF 30-minute chart, the appearance of an Outside Bar can signal increasing selling pressure and the possible start of a bearish trend.
After this signal appears, the formation of Inside Bars may indicate a short consolidation phase within the downward movement. During this time, the market stabilizes briefly before continuing the bearish price movement.
Bearish Trend Interpretation
- Outside Bar formation indicates strong bearish pressure.
- Inside Bars show temporary consolidation during the downtrend.
- These patterns may confirm the continuation of the bearish market structure.
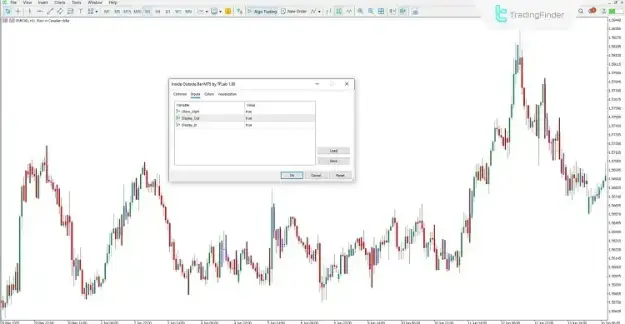
Inside Outside Bar Indicator Settings
The Inside Outside Bar Indicator provides several adjustable parameters that allow traders to customize the indicator according to their individual trading preferences.
Available Settings
- Show_Alert
- Activates or deactivates alert notifications when Inside or Outside Bar patterns are detected.
- Display_Out
- Enables or disables the visualization of Outside Bar candles on the chart.
- Display_In
- Enables or disables the visualization of Inside Bar candles on the chart.
- Enables or disables the visualization of Inside Bar candles on the chart.
Conclusion
The Inside Outside Bar Indicator is an efficient technical analysis tool developed based on price action trading concepts. By automatically identifying and highlighting Inside Bars and Outside Bars on the chart, it allows traders to evaluate market conditions with greater clarity.
When these candlestick formations occur near critical support and resistance levels, they can provide valuable signals related to both trend continuation and potential market reversals. Consequently, this indicator can serve as a useful component within various trading strategies across multiple financial markets and timeframes.