You can access the Indicator from this link:
https://tradingfinder.com/products/i...ation-heatmap/
You can access the Indicator on the TradingView website:
https://www.tradingview.com/script/Q...Science-Stats/
Prop Firm DrawDown Protector : Prop Firm Capital Protection Expert MT5 |Forex Money Management: Forex Trade Management Expert MT5 | ICT Concepts Indicator MT5 |Smart Money Concepts Expert MT5 | Smart Money Trap Scanner |Get a free Expert Advisor license via Telegram and WhatsApp
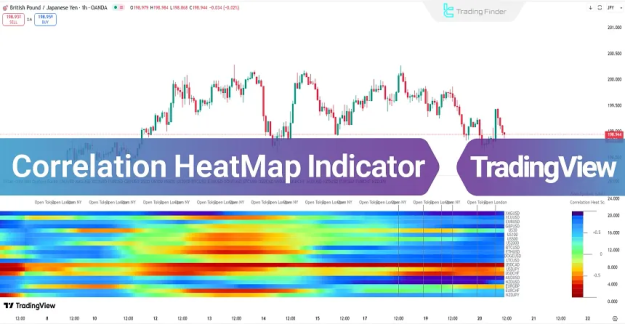
Technical Overview of the Correlation HeatMap
This indicator enables traders to detect alignment or divergence between symbols across various market conditions. By integrating real-time data, the HeatMap offers a dynamic view of how the British Pound Index, Japanese Yen, and other major assets interact. A unique feature of this tool is its ability to overlay global market sessions—such as London, New York, and Tokyo—directly onto the heatmap timeline, allowing for session-specific volatility analysis.
Key Features and Categorization
- Indicator Category: Advanced TradingView Trading Assistants and Heatmap Indicators.
- Supported Platforms: Exclusively optimized for the TradingView platform.
- Target Proficiency: Designed for Intermediate to professional traders.
- Trading Strategy: Primarily utilized for Reversal Trading and trend confirmation.
- Timeframe Versatility: Supports Multi-Timeframe (MTF) analysis.
- Trading Style: Highly effective for Intraday Trading and scalping.
- Market Compatibility: Applicable across Forex, Cryptocurrency, Stocks, Commodities, and Indices.
Understanding the Indicator Logic and Visual Data
The core logic of the Correlation HeatMap revolves around the statistical correlation coefficient. It compares a primary symbol against a curated set of up to 20 comparative symbols.
- Color Matrix Interpretation: The indicator translates complex data into a digestible color scale.
- Positive Correlation (Cold Colors): Shades of blue or green indicate that assets are moving in tandem.
- Negative Correlation (Warm Colors): Shades of red or orange indicate that assets are moving in opposite directions.
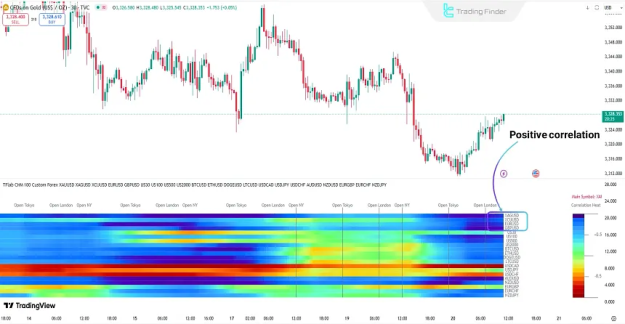
Indicator Performance in Positive Correlation
In a bullish market structure, the transition toward "cold" tones signifies an increase in positive correlation. This shift often mirrors new liquidity inflows and synchronized upward momentum across the selected assets.
- Trading Signal: Strong positive correlation during an uptrend serves as a powerful confirmation for entering or scaling into long (buy) positions.
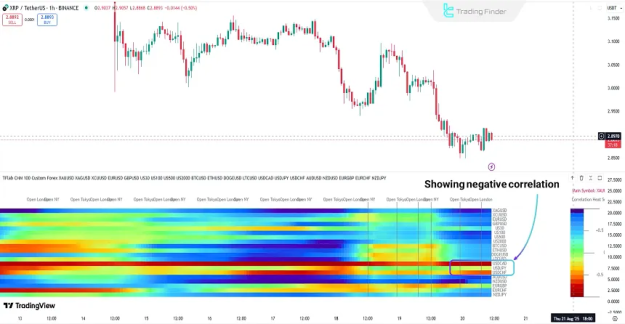
Indicator Performance in Negative Correlation
Conversely, when the spectrum shifts toward "warm" colors (red and orange), it highlights a strengthening negative correlation. This is frequently observed during price declines, signifying heavy selling pressure and liquidity outflows.
- Trading Signal: In a bearish trend, the dominance of warm colors confirms the persistence of downward movement, providing a signal for short (sell) positions.
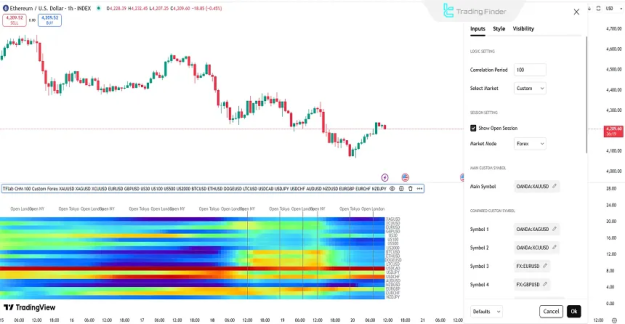
Customizing the Indicator Settings
To maximize the efficacy of the Correlation HeatMap, traders can adjust several parameters within the TradingView interface:
- Logic Settings: Customize the Correlation Period based on a specific number of candles to match your trading horizon.
- Market Selection: Define the primary "Main Symbol" and select up to 20 "Compared Custom Symbols" for a tailored matrix.
- Session Visualization: Enable the Show Open Session feature to track market openings and "Market Mode" transitions directly on the heatmap.
- Symbol Customization: Input specific tickers for Symbol 1 through Symbol 20 to monitor niche correlations in stocks or altcoins.
Conclusion
The Correlation HeatMap Indicator serves as an essential tool for modern traders seeking to understand the hidden links between global markets. By transforming statistical coefficients into a real-time visual map, it simplifies the detection of market alignment and divergence. Whether you are navigating a bullish influx of liquidity or a bearish wave of selling pressure, this indicator provides the data-driven confidence needed to execute high-probability trades.