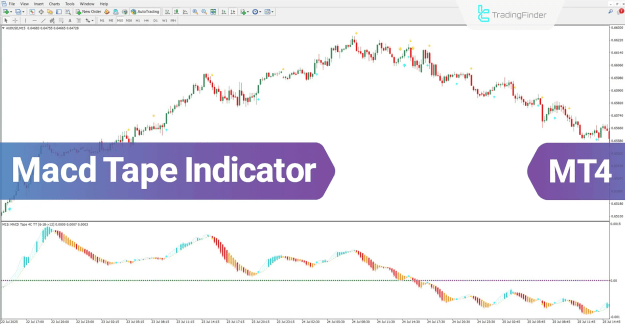
This advanced trading tool highlights the intensity of market flow by shifting histogram colors between light and dark blue during bullish phases and red and orange during bearish conditions.
https://cdn.tradingfinder.com/file/5...4-by-tflab.zip
https://www.cryptocraft.com/thread/1...-for-mt5-tflab
https://www.forexfactory.com/thread/...-in-metatrader
Prop Firm DrawDown Protector : Prop Firm Capital Protection Expert MT4 | Forex Money Management: Forex Trade Management Expert MT4 |ICT Concepts Indicator MT4 | Smart Money Concepts Expert MT4| Smart Money Trap Scanner | Get a free Expert Advisor license via Telegram and WhatsApp
MACD Tape Indicator Specifications
The MACD Tape belongs to multiple technical indicator categories used in MetaTrader 4 (MT4) for market analysis and decision-making.
Indicator Categories
- Oscillators MT4 Indicators
- Signal & Forecast MT4 Indicators
- Momentum Indicators in MT4
Platforms
- MetaTrader 4 Indicators
Trading Skills
- Elementary
Indicator Types
- Reversal MT4 Indicators
Timeframe
- Multi-Timeframe MT4 Indicators
Trading Styles
- Day Trading MT4 Indicators
- Scalping MT4 Indicators
- Swing Trading MT4 Indicators
Trading Instruments
- Share Stocks MT4 Indicators
- Indices Market MT4 Indicators
- Commodity Market MT4 Indicators
- Stock Market MT4 Indicators
- Cryptocurrency MT4 Indicators
- Forex MT4 Indicators
MACD Tape Indicator at a Glance
One of the primary strengths of the MACD Tape oscillator is its ability to generate accurate buy and sell signals.
These signals are derived from the crossover between the MACD line and the signal line, allowing traders to identify potential trend reversals and momentum shifts.
- Blue arrows indicate buy opportunities
- Yellow arrows signal sell opportunities
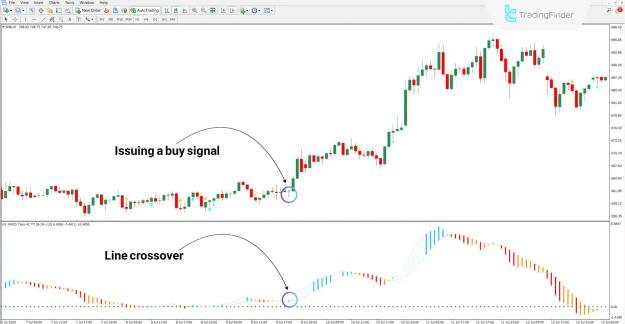
Buy Signal
On the 1-hour Binance Coin (BNB) chart, the MACD Tape oscillator successfully detected a bullish crossover and issued a buy signal at the appropriate market position.
- Persistent light blue histogram bars confirm the strong bullish momentum.
- The visual representation helps traders spot trend continuation more easily.
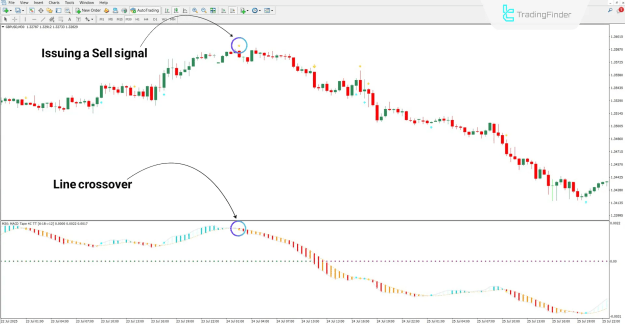
Sell Signal
Based on the GBP/USD 30-minute chart, the indicator triggered a sell signal after detecting a bearish MACD-signal line crossover.
- The appearance of red and orange histogram bars confirms robust bearish momentum.
- This visual confirmation assists traders in identifying effective exit or short-selling opportunities.
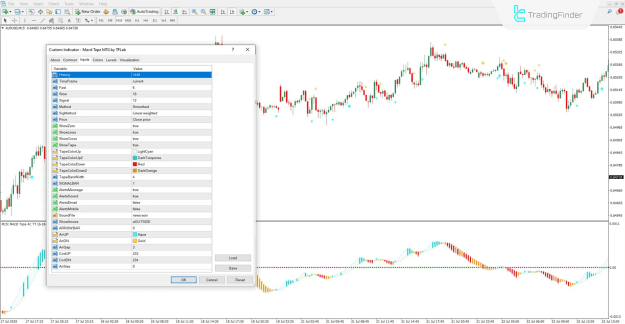
MACD Tape Indicator Settings
The MACD Tape oscillator includes a variety of adjustable parameters, providing flexibility for different trading strategies and market conditions.
Key Adjustable Inputs
- History: Number of candles processed
- TimeFrame: Current chart timeframe
- Fast: Fast moving-average period
- Slow: Slow moving-average period
- Signal: Signal line calculation period
- Method: Averaging method for MACD
- SigMethod: Averaging method for signal line
- Price: Price type for calculations
- ShowZero: Display zero line
- ShowLines: Reference lines in histogram
- ShowCross: Display MACD line crossovers
- ShowTape: Enable histogram color bands
Histogram Color Parameters
- TapeColorUp: Initial bullish color
- TapeColorUp2: Strong bullish color
- TapeColorDown: Initial bearish color
- TapeColorDown2: Strong bearish color
- TapeBarsWidth: Histogram bar width
Signal Generation Settings
- SIGNALBAR: Reference candle for signal alerts
- AlertsMessage: Text notification alerts
- AlertsSound: Sound alerts
- AlertsEmail: Email notifications
- AlertsMobile: Mobile device alerts
- SoundFile: Audio file used for alerts
Arrow Visualization Settings
- ShowArrows: Display arrows outside candles
- ARROWBAR: Reference candle for arrow drawing
- ArrUP: Buy arrow color
- ArrDN: Sell arrow color
- ArrGap: Arrow-to-candle distance
- CodUP: Buy arrow symbol code
- CodDN: Sell arrow symbol code
- ArrSize: Arrow size
Conclusion
The MACD Tape oscillator is a powerful and practical tool in technical analysis, offering enhanced visibility of market momentum through color-coded histograms.
By identifying MACD-signal line crossovers, the indicator provides reliable trading alerts using visually distinct arrows, helping traders detect optimal entry and exit opportunities across various markets and timeframes.