https://cdn.tradingfinder.com/file/5...5-by-tflab.zip
https://www.cryptocraft.com/thread/1...n-metatrader-4
https://www.forexfactory.com/thread/...-in-metatrader
Prop Firm DrawDown Protector : Prop Firm Capital Protection Expert MT5 |Forex Money Management: Forex Trade Management Expert MT5 | ICT Concepts Indicator MT5 |Smart Money Concepts Expert MT5 | Smart Money Trap Scanner | Get a free Expert Advisor license via Telegram and WhatsApp
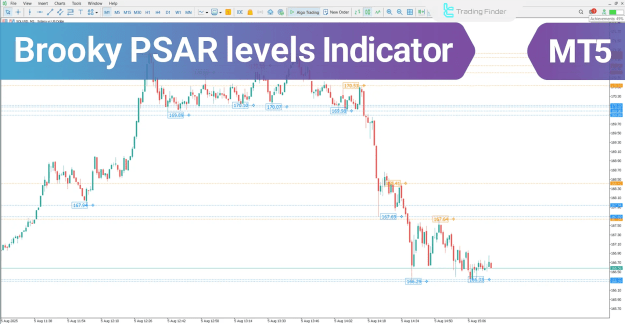
Brooky PSAR Levels Indicator at a Glance
The Brooky PSAR Levels indicator utilizes the core PSAR calculation methodology to identify and clearly mark two key dynamic market levels on the chart using distinct visual colors:
- Resistance (Upper PSAR): Typically identified in uptrends, this level is where selling pressure frequently intensifies. Its presence can lead the price to either reverse downward or breakout higher to continue the trend.
- Support (Lower PSAR): Commonly seen in downtrends, reaching this level usually signals an increase in demand. This heightens the likelihood of a price rebound or a temporary halt in decline.
This sophisticated tool features automatic level updates, making it highly effective for precise determination of entries, exits, or optimal stop-loss placements in trading strategies.
Indicator Categories and Trading Utility
The Brooky PSAR Levels indicator is classified as an Intermediate-level analytical tool, suitable for Multi-Timeframe use across a wide array of instruments on the MT5 platform.
- Platform: MetaTrader 5 Indicators
- Trading Skills: Intermediate
- Indicator Categories:
- Support & Resistance MT5 Indicators
- Trading Assist MT5 Indicators
- Levels MT5 Indicators
- Indicator Types:
- Breakout MT5 Indicators
- Reversal MT5 Indicators
- Timeframe: Multi-Timeframe MT5 Indicators
- Trading Style: Intraday MT5 Indicators
- Applicable Trading Instruments:
- Forex MT5 Indicators
- Crypto MT5 Indicators
- Stock MT5 Indicators
- Commodity MT5 Indicators
- Indices MT5 Indicators
- Share Stock MT5 Indicators
Indicator in an Uptrend: Buy Setup
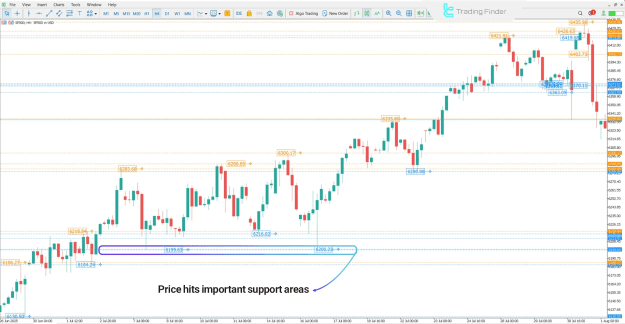
- Analysis: Examining a chart, such as the S&P 500 index on the 4-hour timeframe, when the price approaches a major support level during a downtrend, look for signs of decelerating selling pressure.
- Entry Signal: If a positive reaction occurs—such as the formation of a reversal candlestick pattern or a breakout above a short-term downtrend line—it establishes suitable conditions for a buy-entry trade.
Indicator in a Downtrend: Sell Setup
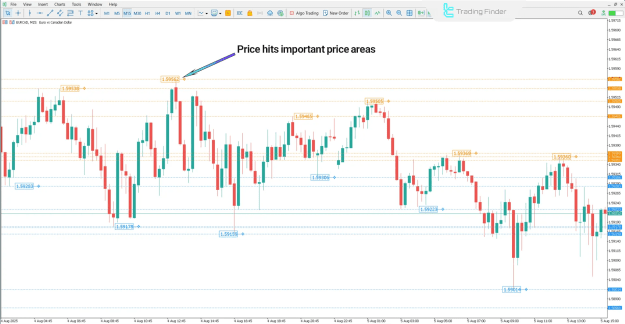
- Analysis: Considering a chart like the EUR/CAD currency pair on the 15-minute timeframe, when the price encounters a significant resistance zone, the appearance of reversal signals (e.g., bearish engulfing patterns or pivot reversal structures) indicates weakening bullish momentum.
- Entry Signal: From a technical perspective, this scenario significantly increases the probability of a new downtrend starting, creating a prime sell-entry opportunity.
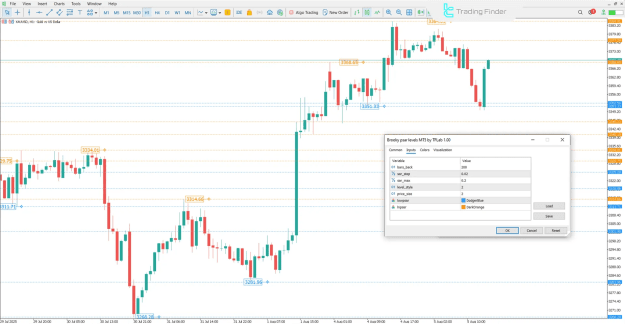
Brooky PSAR Levels Indicator Settings
The settings panel allows traders to customize the calculation and visual presentation of the indicator levels:
- Bars back: Determines the number of previous candles used for the indicator's calculations.
- Sar step: The incremental step value used in the Parabolic SAR calculation.
- Sar max: The maximum allowed acceleration value for the PSAR calculation.
- Level style: Customizes the visual style of the level display on the chart.
- Price size: Adjusts the font size of the price label associated with the levels.
- Lowpsar: An internal variable specifically for PSAR support levels displayed below the candles.
- Hipsar: An internal variable specifically for PSAR resistance levels displayed above the candles.
Conclusion
The Brooky PSAR Levels indicator is an advanced analytical tool that leverages the fundamental PSAR formula to accurately display dynamic support and resistance levels directly on the chart. This trading tool is invaluable because, in addition to defining the trend direction, it effectively identifies significant zones of potential price reversal or breakout. The integration of these levels with traditional price action analysis greatly enhances the accuracy of market analysis and decision-making in both bullish and bearish trading environments.