The Gann Square combines several geometric and time-based analytical tools, including Gann Angles, Gann Square, Gann Fan, and Time Arcs, each contributing to the detection of critical trading zones and market behavior patterns.
https://cdn.tradingfinder.com/file/5...4-by-tflab.zip
https://www.cryptocraft.com/thread/1...trader-5-tflab
https://www.forexfactory.com/thread/...-in-metatrader
Prop Firm DrawDown Protector : Prop Firm Capital Protection Expert MT4 | Forex Money Management: Forex Trade Management Expert MT4 |ICT Concepts Indicator MT4 | Smart Money Concepts Expert MT4| Smart Money Trap Scanner | Get a free Expert Advisor license via Telegram and WhatsApp
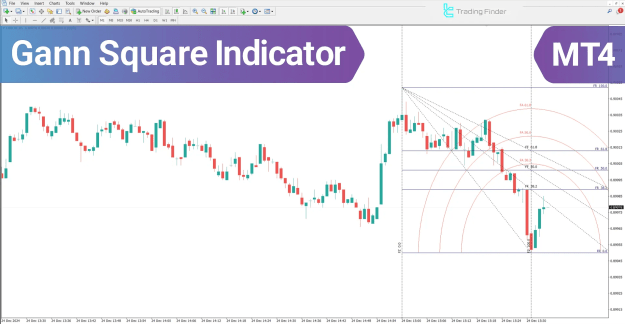
Gann Square Indicator Overview
The Gann Square Indicator for MetaTrader 4 (MT4) integrates price movement with time cycles to determine key entry and exit points.
Its analytical framework is based on three core principles:
- Symmetry of Time and Price:
When price and time align at a particular level, the likelihood of a trend reversal increases. - Gann Angles and Diagonal Analysis:
A breakout or touch of significant Gann angles often indicates either trend continuation or a shift in market direction. - Price-Time Confluence:
The intersection of fan lines, horizontal price levels, and vertical time lines usually triggers strong market reactions and potential trading opportunities.
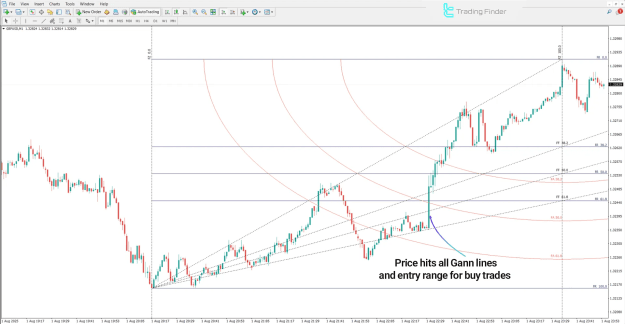
Indicator in an Uptrend
In an uptrend scenario (e.g., GBP/USD on the 1-minute chart), when the price remains above the 61.8% Fibonacci level while breaking through higher Gann angles such as 50, it signals bullish momentum and strong buying pressure.
Additionally, when ascending fan lines align with primary time cycles, a confirmation for long positions is established.
- The indicator highlights market demand dominance during price expansion phases.
- Confluence zones act as precise long-entry signals.
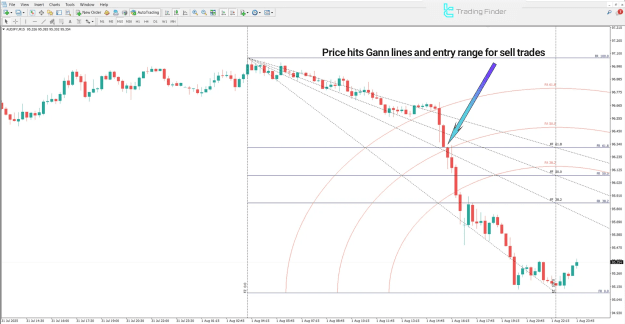
Indicator in a Downtrend
In a downtrend (e.g., AUD/JPY on the 15-minute chart), when the price moves below the 61.8% Fibonacci level and breaks descending Gann angles, it reflects growing selling pressure.
If this pattern coincides with bearish intersections or time cycle peaks, the probability of further downside movement increases.
- Bearish fan line intersections signal trend continuation.
- Ideal conditions appear near sensitive time cycle peaks and retracement zones.
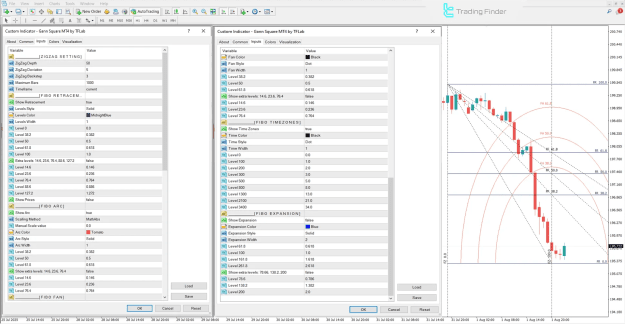
Gann Square Indicator Settings
The Gann Square Indicator settings panel in MetaTrader 4 provides a comprehensive configuration for geometric and Fibonacci components. Traders can fine-tune visual and functional parameters to adapt the indicator to various market conditions.
ZigZag Settings
- ZigZag Depth: Adjusts sensitivity to price swings
- ZigZag Deviation: Defines the minimum price change for a new leg
- ZigZag Backstep: Filters false pivot points
- Maximum Bars: Determines the number of candles used in calculation
- Timeframe: Sets the analysis period
Fibonacci Retracement
- Show Retracement: Enables or disables Fibonacci retracement display
- Level Style / Color / Width: Controls the visual appearance of retracement lines
- Key Levels:
- 0% — Baseline Price Level
- 38.2% — Golden Ratio Zone
- 50% — Midpoint Retracement
- 61.8% — Key Fibonacci Ratio
- 100% — Full Price Range
- Extra Levels:
- 14.6%, 23.6%, 76.4%, 88.6%, 127.2% — Additional Fibonacci ratios
- Show Prices: Displays price labels on retracement lines
Fibonacci Arc
- Show Arc: Displays Fibonacci arcs
- Scaling Method: Sets the arc scaling mode (automatic or manual)
- Manual Scale Value: Input for custom scaling
- Arc Color / Style / Width: Visual customization
- Key Levels: 38.2%, 50%, 61.8%
- Extra Levels: 14.6%, 23.6%, 76.4%
Fibonacci Fan
- Fan Color / Style / Width: Configures fan line visuals
- Key Levels: 38.2%, 50%, 61.8%
- Extra Levels: 14.6%, 23.6%, 76.4%
- Fan intersections with price structure highlight trend confirmation or potential reversals
Fibonacci Time Zones
- Show Time Zones: Displays Fibonacci-based time intervals
- Time Color / Style / Width: Customizes appearance
- Key Levels: 0%, 100%, 200%, 300%, 500%, 800%, 1300%, 2100%, 3400%
- These intervals mark important time cycles and potential reversal periods
Fibonacci Expansion
- Show Expansion: Projects future price targets
- Expansion Color / Style / Width: Visual customization
- Key Levels:
- 61.8% — Golden Ratio Target
- 100% — Full Range Projection
- 161.8%, 261.8% — Extended Expansion Levels
- Extra Levels: 78.6%, 138.2%, 200%
Conclusion
The Gann Square Indicator is one of the most advanced analytical tools in technical analysis, combining market geometry, time cycles, and price symmetry to identify trend structures, reversal points, and critical support/resistance zones.
Its integrated features—Gann Angles, Gann Fan, Time Arcs, and Fibonacci tools—allow traders to analyze markets with mathematical precision and predictive depth.
By applying these principles, traders can effectively determine optimal entry and exit zones and forecast potential market reactions based on the balance between time and price.