https://cdn.tradingfinder.com/file/5...5-by-tflab.zip
https://www.cryptocraft.com/thread/1...e-trade-timing
https://www.forexfactory.com/thread/...-in-metatrader
Prop Firm DrawDown Protector : Prop Firm Capital Protection Expert MT5 |Forex Money Management: Forex Trade Management Expert MT5 | ICT Concepts Indicator MT5 |Smart Money Concepts Expert MT5 | Smart Money Trap Scanner | Get a free Expert Advisor license via Telegram and WhatsApp
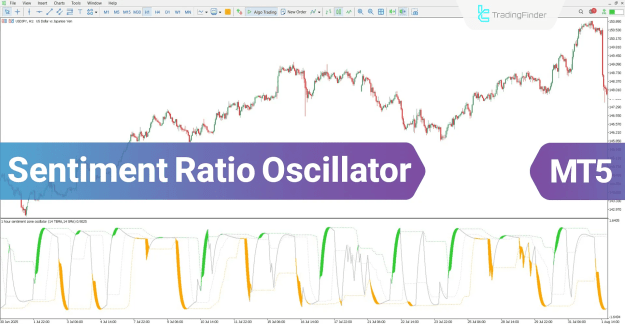
Sentiment Ratio Oscillator at a Glance
The core functionality of the Sentiment Ratio Oscillator is the generation of trade signals through the analysis of market overbought and oversold zones.
- When the oscillator curve enters these extreme zones, the probability of an impending price reversal increases.
- Subsequently, the contact or crossover of the indicator's main line with the signal line can be precisely interpreted as potential opportunities for trade entries.
Specifications and Applications
The Sentiment Ratio Oscillator is a versatile MT5 Indicator suitable for traders with an Intermediate skill level, designed for use across multiple timeframes and trading styles.
- Platform: MetaTrader 5 Indicators
- Indicator Categories:
- Oscillators MT5 Indicators
- Signal & Forecast MT5 Indicators
- Volatility MT5 Indicators
- Market Sentiment Analysis Indicators for MT5
- Indicator Type: Reversal MT5 Indicators
- Timeframe: Multi-Timeframe MT5 Indicators
- Applicable Trading Styles:
- Swing Trading MT5 Indicators
- Scalper MT5 Indicators
- Day Trading MT5 Indicators
- Applicable Trading Instruments:
- Forex MT5 Indicators
- Crypto MT5 Indicators
- Stock MT5 Indicators
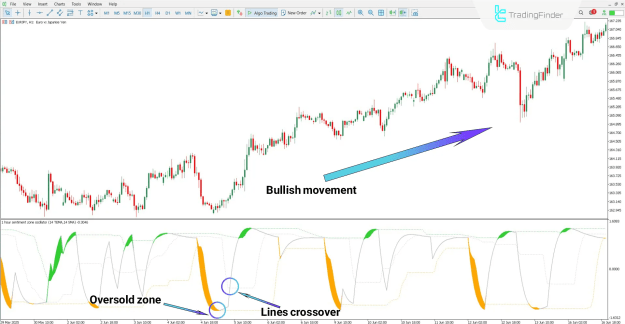
Buy Setup Example
- Condition: On the USD/JPY chart (e.g., 1-hour timeframe), the oscillator curve enters the oversold zone, suggesting imminent trend reversal.
- Signal: The upward crossover of the indicator curve with the grey signal line is classified as a valid buy signal.
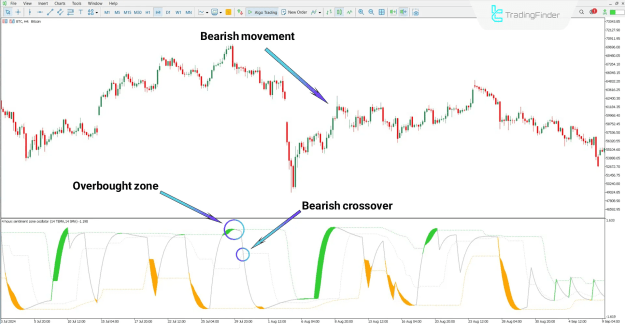
Sell Setup Example
- Condition: Examining a chart like Bitcoin (BTC), after the price movement pushes the oscillator into the overbought zone, signs of a downward reversal become apparent.
- Signal: In these conditions, the downward crossover of the oscillator curve with the signal line is considered a suitable sell trade setup.
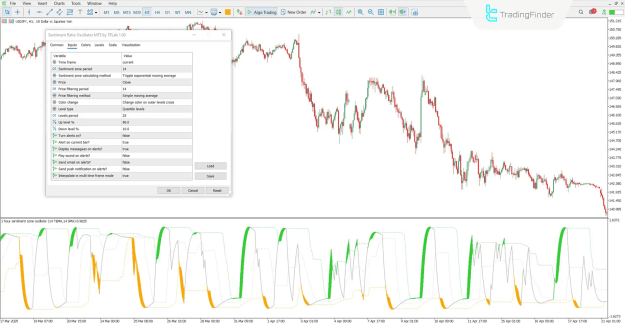
Sentiment Ratio Oscillator Settings
The indicator features a robust settings box on MetaTrader 5, enabling comprehensive customization of its calculation and alert parameters:
- Time frame: Specifies the active chart timeframe used for the indicator calculation.
- Sentiment zone period: Defines the number of candles used for the sentiment zone formation.
- Sentiment zone calculating method: Utilizes the Triple Exponential Moving Average method for calculation.
- Price: Determines the type of base price used (e.g., Close, Open, High, Low).
- Price filtering period: The number of candles used for price movement filtering.
- Price filtering method: Specifies the Simple Moving Average (SMA) for price filtering.
- Color change: Sets the criteria for line color change (e.g., on curve crossover levels).
- Level type: Defines the type of calculation levels used.
- Levels period: The number of candles for sensitive levels calculation.
- Up level %: The upper percentage used for the overbought zone calculation.
- Down level %: The lower percentage used for the oversold zone calculation.
- Alert Options (Turn alerts on, Alert on current bar, Display messages, Play sound, Send email, Send push notification): Comprehensive options for signal alert activation and delivery.
- Interpolate in multi time frame mode: Option for continuous curve display when operating in multi-timeframe mode.
Conclusion
The Sentiment Ratio Oscillator utilizes moving averages (MA) and percentage-based fluctuations to precisely identify overbought and oversold zones. Critically, the contact or crossover of the main oscillator curve with the grey line (which represents the general market sentiment) is frequently interpreted as the optimal timing for entering trade positions, allowing traders to capitalize on potential price reversals.