https://cdn.tradingfinder.com/file/4...5-by-tflab.zip
https://www.cryptocraft.com/thread/1...er4-free-tflab
https://www.forexfactory.com/thread/...-in-metatrader
Prop Firm DrawDown Protector : Prop Firm Capital Protection Expert MT5 |Forex Money Management: Forex Trade Management Expert MT5 | ICT Concepts Indicator MT5 |Smart Money Concepts Expert MT5 | Smart Money Trap Scanner | Get a free Expert Advisor license via Telegram and WhatsApp
Core Principle of the SSMT 4 Quarter Divergence
The foundational operation of this indicator involves the selection of two correlated assets, for instance, the NQ100 and JP225 indices. This established correlation is a prerequisite for the analysis to be effective.
- Multi-Timeframe Analysis: The tool functions across multiple timeframes, making it suitable for intraday trading strategies.
- Advanced Reversal Identification: It is primarily designed as a reversal indicator, pinpointing potential exhaustion points in a trend.
- Wide Applicability: It can be applied to various trading instruments, including Forex pairs, Cryptocurrencies, and Stock Indices.
SSMT 4 Quarter Divergence at a Glance
By detecting structural divergence between correlated assets and aligning these signals with defined market time cycles, the SSMT 4 Quarter Divergence acts as a precision tool for identifying critical phase-shift zones. The emergence of divergence at the transition points between these time phases often signals smart money entry and a potential trend reversal.
Confirmation of these signals is achieved through a break in market structure and the formation of pivot points on lower timeframes. The convergence of these elements creates a robust framework for identifying high-probability entry opportunities with well-defined risk parameters, typically within premium (overbought) and discount (oversold) zones.
Trading Scenarios with the SSMT 4 Quarter Divergence Indicator
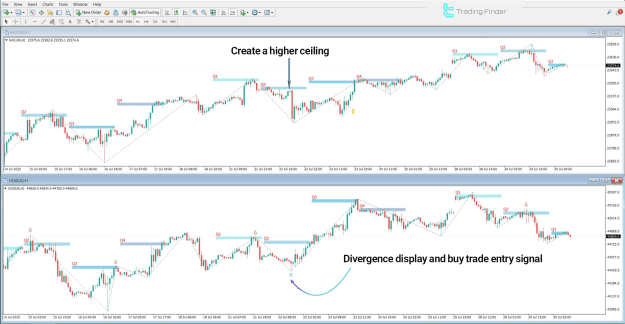
Identifying Bullish Reversals
In a bullish scenario, a temporal divergence is observed between two correlated indices, such as the NAS100 and US30, on a specific timeframe like the 1-hour chart.
- The US30 index breaks below a previous swing low.
- Simultaneously, the NAS100 index holds its price structure and does not confirm the breakdown.
- This behavioral discrepancy is interpreted as smart money absorbing selling pressure in the stronger asset (NAS100).
- A confirmed buy setup is formed when this divergence is followed by a bullish candlestick pattern and a break of market structure on a lower timeframe.
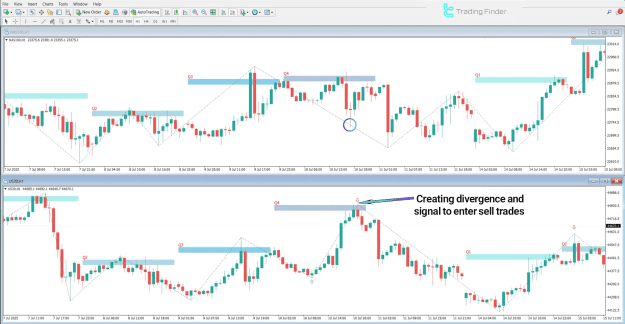
Identifying Bearish Reversals
In a bearish trend scenario, the indicator looks for weakness in a rally.
- The US30 index breaks above a previous swing high.
- However, the correlated NAS100 index fails to confirm this strength and does not break its own corresponding high.
- This divergence suggests weakening buying power and the gradual distribution of assets by smart money.
- A high-probability sell setup is confirmed upon the appearance of a strong bearish candlestick accompanied by a break of market structure to the downside.
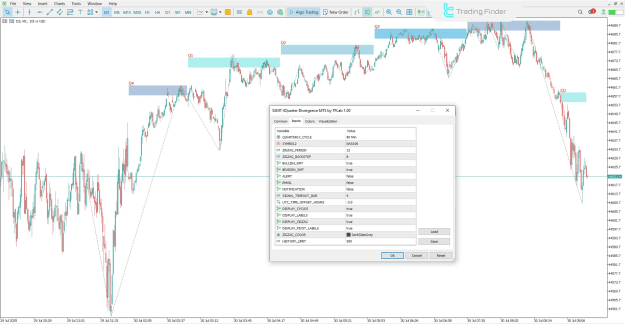
Configuring the SSMT 4 Quarter Divergence Indicator in MetaTrader 5
The settings panel of the SSMT 4 Quarter Divergence Indicator in MT5 allows for extensive customization to align with a trader's specific strategy. Key parameters include:
- QUARTERLY CYCLE: Defines the type of quarterly time division used for analysis.
- SYMBOL2: The ticker symbol of the second, correlated asset for comparison.
- ZIGZAG PERIOD & BACKSTEP: Controls the sensitivity and confirmation requirements for pivot point detection.
- BULLISH/BEARISH SMT: Enables or disables the display of specific divergence signals.
- ALERT, EMAIL, NOTIFICATION: Manages the alert systems for new trading signals.
- DISPLAY CYCLES, LABELS, ZIGZAG: Toggles the visual components on the chart for a cleaner or more detailed view.
Conclusion
The SSMT 4 Quarter Divergence Indicator provides a structured methodology for analyzing market behavior by segmenting time into four sequential quarters. Divergence between correlated assets within this framework serves as a powerful signal of phase shifts and changes in liquidity flow orchestrated by smart money participants. For traders operating within the ICT style or similar methodologies, this tool offers an effective means of identifying potential market turning points and reversal zones with enhanced precision.