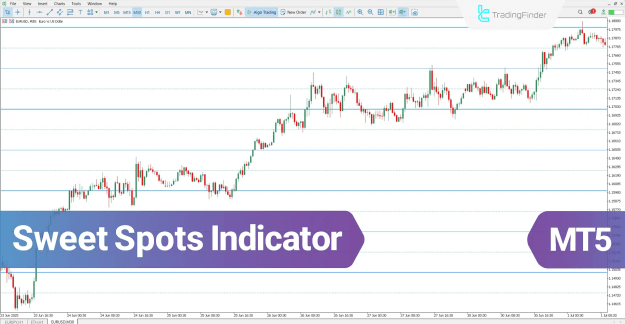


These zones often represent areas where market reactions occur, as both retail traders and institutional investors tend to place their take-profit and stop-loss orders near these levels.
By plotting major and minor levels, the indicator helps traders quickly recognize potential support and resistance zones, making it easier to anticipate market reversals and continuations.
 You can download it from this link:
https://cdn.tradingfinder.com/file/4...5-by-tflab.zip
 You can also access the MetaTrader 4 version of this Indicator through this page:
https://www.cryptocraft.com/thread/1...tatrader-4-mt4
 For instructions on how to install:
https://www.forexfactory.com/thread/...-in-metatrader
Prop Firm DrawDown Protector : Prop Firm Capital Protection Expert MT5 |Forex Money Management: Forex Trade Management Expert MT5 | ICT Concepts Indicator MT5 |Smart Money Concepts Expert MT5 | Smart Money Trap Scanner | Get a free Expert Advisor license via Telegram and WhatsApp
Sweet Spots Indicator Specifications
Indicator Categories:
- Support & Resistance MT5 Indicators
- Trading Assist MT5 Indicators
- Levels MT5 Indicators
Platform: MetaTrader 5
Skill Level: Elementary
Indicator Type: Breakout & Reversal MT5 Indicator
Timeframe: Multi-Timeframe
Trading Styles: Swing Trading, Scalping, Day Trading
Applicable Instruments: Forex, Crypto, Stocks
When price approaches the predefined Sweet Spot levels, the likelihood of a reaction significantly increases.
By combining these levels with price action concepts, traders can determine the next market direction with greater precision.
Bullish Example
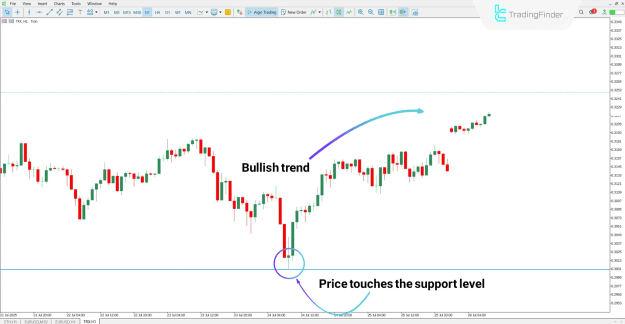
In the 1-hour chart of TRON (TRX), the price reacts upward after reaching one of the highlighted levels.
Here, the blue line acts as a support zone, providing a favorable condition for entering a buy position.
This demonstrates how the Sweet Spots Indicator can help identify bullish reversal points.
Bearish Example
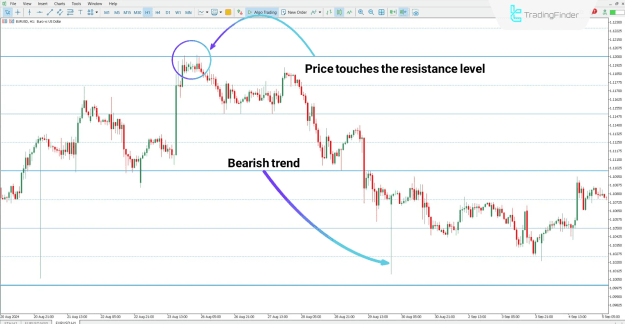
In the EUR/USD chart, the blue line functions as a resistance level.
Once price touches this level, a downward move follows — signaling an opportunity for a sell trade.
These levels can be integrated into any trading strategy to enhance sell entry accuracy.
Recommended Trading Tools
- TradingFinder Forex Rebate Calculator – Cashback for 50+ currency pairs
- Forex Economic Calendar – Real-time data for over 150 countries
- Crypto Market Watch (Telegram App) – Monitor 16,000+ cryptocurrencies
- Pip Value Calculator – Calculate pip values for 70+ trading instruments
Sweet Spots Indicator Settings
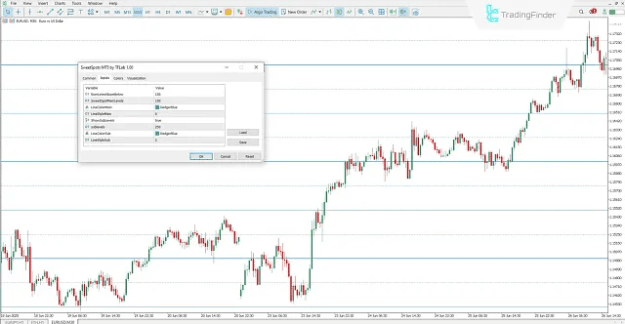
Below are the main adjustable parameters of the Sweet Spots Indicator:
- NumLinesAboveBelow: Sets how many lines appear above and below the current price
- SweetSpotMainLevels: Defines the distance between major levels
- LineColorMain / LineStyleMain: Customizes color and style of main level lines
- ShowSubLevels: Enables or disables display of sub-levels
- Sublevels: Distance between minor levels
- LineColorSub / LineStyleSub: Adjusts color and style of sub-level lines
Conclusion
The Sweet Spots Indicator for MT5 automatically marks key psychological price levels, helping traders spot strong support and resistance zones where major price reactions are likely to occur.
By analyzing price behavior around these levels, traders can identify high-probability entry and exit points and strengthen the accuracy of their technical trading strategies.