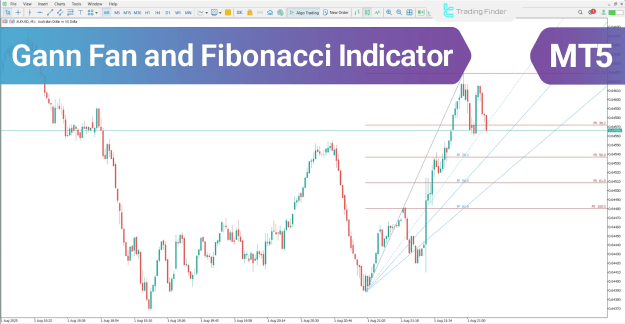
Unlike conventional tools that rely solely on price movements, this indicator analyzes the geometric structure of the market in both price and time dimensions. Areas where Gann angles and Fibonacci levels intersect are considered high-probability zones for initiating buy or sell trades.
https://cdn.tradingfinder.com/file/5...5-by-tflab.zip
https://www.cryptocraft.com/thread/1...r-mt4-download
https://www.forexfactory.com/thread/...-in-metatrader
Prop Firm DrawDown Protector : Prop Firm Capital Protection Expert MT5 |Forex Money Management: Forex Trade Management Expert MT5 | ICT Concepts Indicator MT5 |Smart Money Concepts Expert MT5 | Smart Money Trap Scanner | Get a free Expert Advisor license via Telegram and WhatsApp
Key Features of the Gann Fan and Fibonacci Indicator
- Indicator Category: Trading Assist, Levels
- Platform: MetaTrader 5
- Skill Level: Intermediate
- Indicator Type: Reversal
- Timeframe: Multi-Timeframe
- Trading Style: Intraday
- Applicable Instruments: Forex, Cryptocurrencies, Stocks, Commodities, Indices
Overview of the Gann Fan and Fibonacci Indicator
In MetaTrader 5, the indicator identifies support, resistance, and price reversal zones by combining Gann angles with Fibonacci retracement levels.
- Gann Angles: Represent the relationship between time and price, drawn diagonally.
- Fibonacci Levels: Horizontal lines indicating potential retracement points or trend continuation zones.
- Intersection Zones: When Gann angles and Fibonacci levels overlap, they form potential trade entry points.
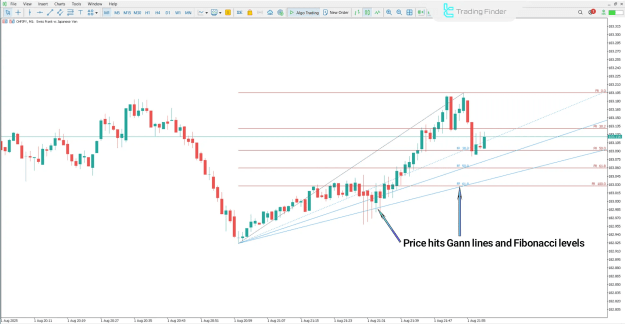
Application in an Uptrend
For example, consider the CHF/JPY currency pair on a 30-minute timeframe:
- A buy signal is confirmed when the price touches a Gann support line and simultaneously aligns with a Fibonacci retracement level.
- This overlap highlights a high-probability price reversal zone.
- A positive reaction in this zone can serve as a valid entry point for long positions.
Key Points in Uptrend:
- Buy signals occur at intersections of support and Fibonacci retracement.
- Zones indicate high probability of upward price movement.
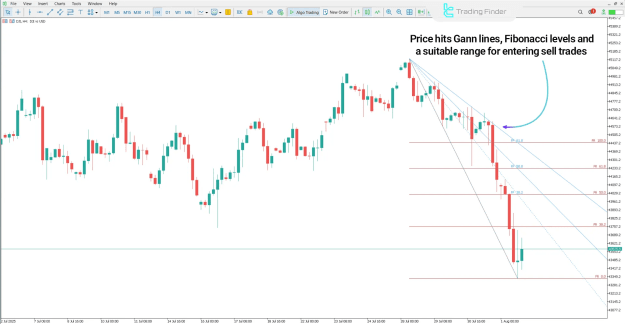
Application in a Downtrend
For instance, using the Dow Jones Index (DJI) on a 4-hour timeframe:
- A sell signal emerges when the price touches a Gann resistance line and coincides with a significant Fibonacci retracement level.
- This intersection creates a high-tension area, increasing the probability of a downward price reversal.
Key Points in Downtrend:
- Sell zones form at intersections of resistance and Fibonacci retracement levels.
- These zones indicate high-probability points for short positions.
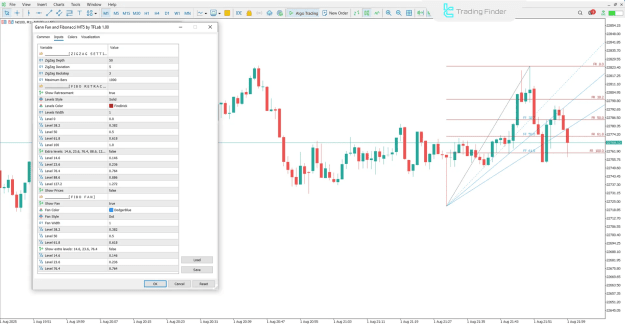
Gann Fan and Fibonacci Indicator Settings
ZigZag Settings:
- ZigZag Depth: Adjusts sensitivity of swing detection
- ZigZag Deviation: Controls allowable price deviation
- ZigZag Backstep: Defines minimum swing distance
- Maximum Bars: Sets the number of candles analyzed
Fibonacci Retracement Settings:
- Show Retracement: Toggle Fibonacci levels on/off
- Levels Style & Color: Customize line appearance
- Levels Width: Adjust thickness of retracement lines
- Key Levels: 0%, 38.2%, 50%, 61.8%, 100%
- Extra Levels: 14.6%, 23.6%, 76.4%, 88.6%, 127.2%
- Show Prices: Display price values on levels
Fibonacci Fan Settings:
- Show Fan: Toggle fan lines on/off
- Fan Color & Style: Customize appearance
- Fan Width: Adjust line thickness
- Key Fan Angles: 38.2%, 50%, 61.8%
- Extra Levels: 14.6%, 23.6%, 76.4%
Conclusion
The Gann Fan and Fibonacci Indicator is a powerful tool for identifying support, resistance, and price reversal zones. By simultaneously analyzing time and price ratios, it pinpoints high-probability trade entry areas, enhancing decision-making in intraday and multi-timeframe trading strategies.