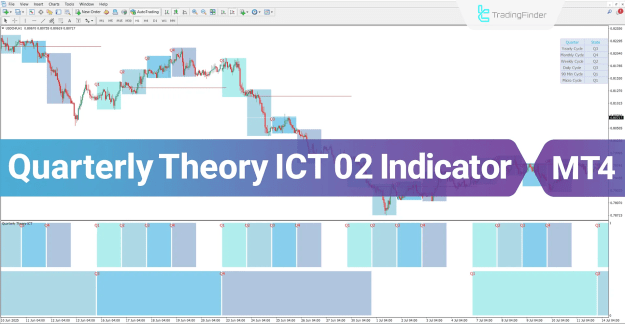
The Quarterly Theory ICT 02 Indicator is a sophisticated analytical tool built upon ICT-style market concepts and the principle of fractal timing. This powerful trading tool deconstructs the market into organized, recurring cycles and systematically identifies repeating price phases across time. These market phases are clearly defined across four distinct stages—Q1, Q2, Q3, and Q4. Crucially, this fractal structure allows the indicator to consistently repeat these phases across all timeframes, including micro, daily, weekly, and yearly cycles, based on the trader's preference.
 You can download it from this link:
https://cdn.tradingfinder.com/file/4...4-by-tflab.zip
 You can also access the MetaTrader 5 version of this Indicator through this page:
https://www.cryptocraft.com/thread/1...-mt5-indicator
 For instructions on how to install:
https://www.forexfactory.com/thread/...-in-metatrader
Prop Firm DrawDown Protector : Prop Firm Capital Protection Expert MT4 | Forex Money Management: Forex Trade Management Expert MT4 |ICT Concepts Indicator MT4 | Smart Money Concepts Expert MT4| Smart Money Trap Scanner | Get a free Expert Advisor license via Telegram and WhatsApp
Quarterly Theory ICT 02 True Open Indicator at a Glance
A cornerstone feature of the Quarterly Theory ICT 02 Indicator is its emphasis on the "True Open" concept. This refers to the genuine opening point of the market for any given cycle. This critical level manifests at the start of the second phase (Q2) of each cycle and acts as the primary benchmark for analyzing the subsequent direction of price movement. The indicator plots this True Open point as a distinct line directly onto the price chart, providing a clear visual reference for traders.
Identifying Trend Direction with the ICT 02 Indicator
The True Open level serves as a dynamic line in the sand, enabling traders to objectively assess market bias and potential momentum.
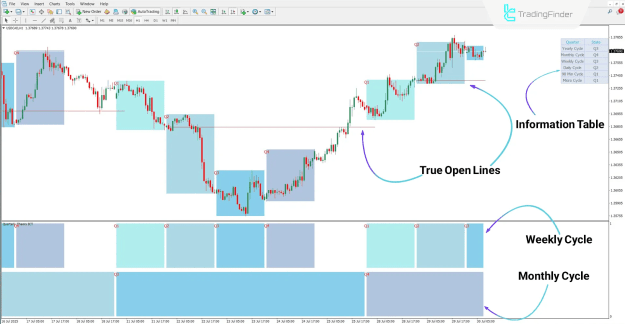
Bullish Trend Conditions
In a bullish market structure, price action will demonstrate specific behaviors relative to the True Open level. As illustrated in a USD/CAD 1-hour chart scenario, when the price stabilizes and trades above the True Open level, it signals that the market has entered the Q2 and Q3 phases of bullish expansion. Under these conditions, as long as the price maintains its position above this critical level, the bullish trend is considered intact and likely to continue.
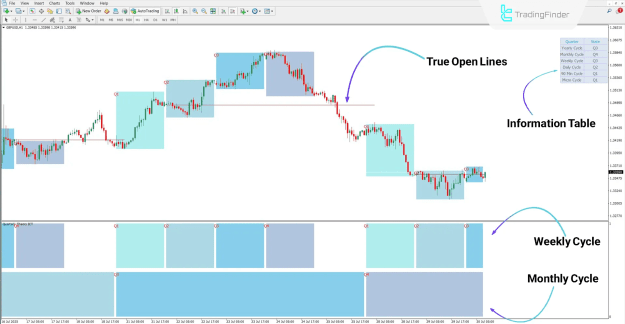
Bearish Trend Conditions
Conversely, a bearish trend is characterized by price trading below the True Open level. Analysis of a GBP/USD chart often reveals that when price stabilizes beneath this line, it typically initiates strong bearish momentum and a phase of distribution. In this context, the bearish trend is expected to persist for as long as the price fails to reclaim and stabilize above the True Open line.
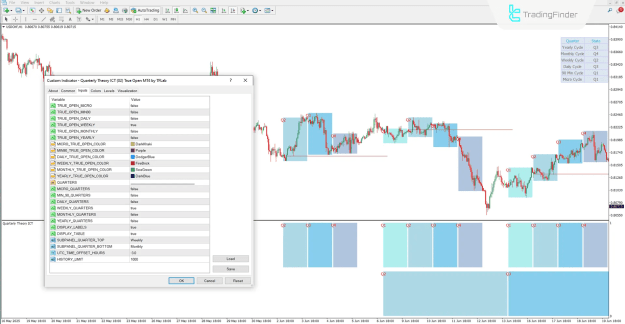
Comprehensive Quarterly Theory ICT 02 Indicator Settings
The indicator is highly customizable, allowing traders to tailor its display to their specific analytical needs. The settings panel is divided into logical sections for clarity and ease of use.
Display Settings for True Open Levels
Traders can activate or deactivate the True Open line for various market cycles. Each cycle's True Open can also be assigned a unique color for immediate visual identification on the chart.
https://cdn.tradingfinder.com/file/4...4-by-tflab.zip
https://www.cryptocraft.com/thread/1...-mt5-indicator
https://www.forexfactory.com/thread/...-in-metatrader
Inserted Video
Prop Firm DrawDown Protector : Prop Firm Capital Protection Expert MT4 | Forex Money Management: Forex Trade Management Expert MT4 |ICT Concepts Indicator MT4 | Smart Money Concepts Expert MT4| Smart Money Trap Scanner | Get a free Expert Advisor license via Telegram and WhatsApp
Quarterly Theory ICT 02 True Open Indicator at a Glance
A cornerstone feature of the Quarterly Theory ICT 02 Indicator is its emphasis on the "True Open" concept. This refers to the genuine opening point of the market for any given cycle. This critical level manifests at the start of the second phase (Q2) of each cycle and acts as the primary benchmark for analyzing the subsequent direction of price movement. The indicator plots this True Open point as a distinct line directly onto the price chart, providing a clear visual reference for traders.
Identifying Trend Direction with the ICT 02 Indicator
The True Open level serves as a dynamic line in the sand, enabling traders to objectively assess market bias and potential momentum.
Bullish Trend Conditions
In a bullish market structure, price action will demonstrate specific behaviors relative to the True Open level. As illustrated in a USD/CAD 1-hour chart scenario, when the price stabilizes and trades above the True Open level, it signals that the market has entered the Q2 and Q3 phases of bullish expansion. Under these conditions, as long as the price maintains its position above this critical level, the bullish trend is considered intact and likely to continue.
Bearish Trend Conditions
Conversely, a bearish trend is characterized by price trading below the True Open level. Analysis of a GBP/USD chart often reveals that when price stabilizes beneath this line, it typically initiates strong bearish momentum and a phase of distribution. In this context, the bearish trend is expected to persist for as long as the price fails to reclaim and stabilize above the True Open line.
Comprehensive Quarterly Theory ICT 02 Indicator Settings
The indicator is highly customizable, allowing traders to tailor its display to their specific analytical needs. The settings panel is divided into logical sections for clarity and ease of use.
Display Settings for True Open Levels
Traders can activate or deactivate the True Open line for various market cycles. Each cycle's True Open can also be assigned a unique color for immediate visual identification on the chart.
- TRUE_OPEN_MICRO: Toggles the display of the True Open for micro cycles.
- TRUE_OPEN_MIN90: Toggles the display of the True Open for 90-minute cycles.
- TRUE_OPEN_DAILY: Toggles the display of the True Open for daily cycles.
- TRUE_OPEN_WEEKLY: Toggles the display of the True Open for weekly cycles.
- TRUE_OPEN_MONTHLY: Toggles the display of the True Open for monthly cycles.
- TRUE_OPEN_YEARLY: Toggles the display of the True Open for yearly cycles.
Configuration for Market Quarters
This section controls the visualization of the four market phases (Q1-Q4) for each cycle and the display of informational elements.
- Cycle Quarters: Enables the division and display of the Q1-Q4 phases for micro, 90-minute, daily, weekly, monthly, and yearly cycles.
- DISPLAY_LABELS: Controls the visibility of Q1, Q2, Q3, and Q4 labels directly on the price chart.
- DISPLAY_TABLE: Activates a status table that shows the current phase for all enabled market cycles.
- SUBPANEL_QUARTER_TOP/BOTTOM: Selects which cycles are displayed in the top and bottom positions of the status table.
- UTC_TIME_OFFSET_HOURS: Allows users to adjust the time offset from UTC to align with their specific trading session or market hours.
- HISTORY_LIMIT: Defines the number of historical candles the indicator uses to calculate and display its data on the chart.
Conclusion
The Quarterly Theory ICT 02 Indicator stands as a multi-layered analytical system that introduces a structured, time-based framework into a trader's decision-making process. The core of this advanced trading tool lies in its precise identification and plotting of the "True Open." This level provides an objective foundation for determining price direction, making the indicator a valuable asset for day traders, scalpers, and swing traders across forex, cryptocurrency, and stock markets.
Attached Image(s) (click to enlarge)