To improve precision in varying market conditions, the indicator allows traders to scale the channel using either Average True Range (ATR) or standard deviation, ensuring greater reliability when volatility fluctuates.
https://cdn.tradingfinder.com/file/4...4-by-tflab.zip
https://www.cryptocraft.com/thread/1...-smart-trading
https://www.forexfactory.com/thread/...-in-metatrader
Prop Firm DrawDown Protector : Prop Firm Capital Protection Expert MT4 | Forex Money Management: Forex Trade Management Expert MT4 |ICT Concepts Indicator MT4 | Smart Money Concepts Expert MT4| Smart Money Trap Scanner | Get a free Expert Advisor license via Telegram and WhatsApp
Key Specifications of the Regression Trend Channel Indicator
The Regression Trend Channel Indicator is classified under several key MetaTrader 4 categories and trading tools:
- Indicator Categories: Support & Resistance, Trading Assist, Bands & Channels
- Platform: MetaTrader 4
- Skill Level: Best suited for intermediate traders
- Indicator Type: Breakout and Reversal indicator
- Timeframes: Compatible with multi-timeframe analysis
- Trading Style: Ideal for intraday strategies
- Applicable Instruments: Forex, Stocks, and Cryptocurrencies
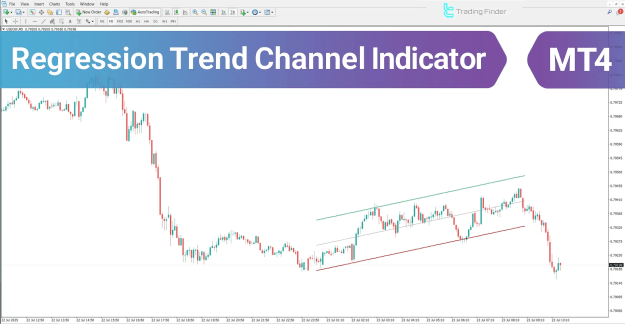
How the Regression Trend Channel Indicator Works
This indicator constructs a three-part linear regression channel that adapts to market conditions:
- Centerline – Plots the average price trajectory over a specified period, highlighting the primary market direction.
- Upper Band – Determined by adding a deviation value (ATR or standard deviation) to the centerline, serving as a dynamic resistance level.
- Lower Band – Created by subtracting the deviation value from the centerline, providing a dynamic support zone.
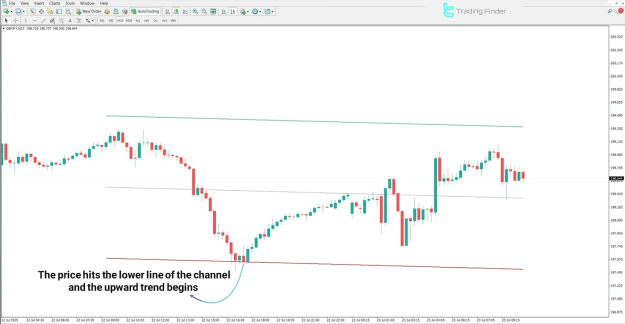
Applying the Indicator in an Uptrend
When markets are in an uptrend, the Regression Trend Channel offers strategic trading signals:
- Prices staying above the centerline and moving toward the upper band indicate strong buying momentum.
- A pullback to the centerline followed by bullish confirmation candles suggests a favorable buy entry zone.
Example: On the GBP/JPY 15-minute chart, a retracement to the centerline with a positive price reaction creates an ideal buying opportunity.
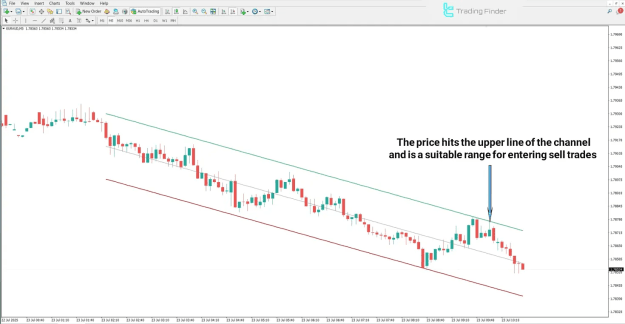
Applying the Indicator in a Downtrend
During bearish market phases, the indicator supports traders in identifying short setups:
- Prices below the centerline and testing the lower band reflect dominant selling pressure.
- A return to the centerline, followed by consolidation beneath it and bearish candlestick patterns, strengthens a sell setup.
Example: On the EUR/AUD 5-minute chart, rejection at the centerline signals a potential short entry.
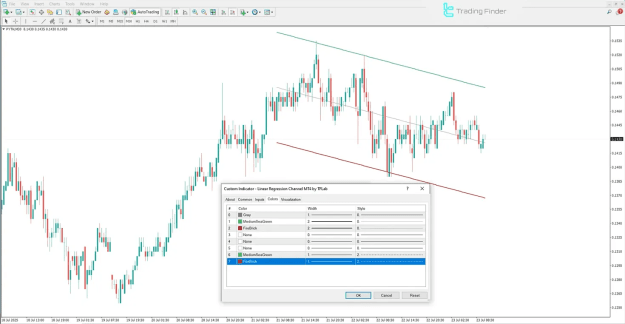
Customizing the Regression Trend Channel Settings
The indicator includes a user-friendly settings panel that allows traders to adjust its appearance and functionality:
- Color customization (Gray, Medium Sea Green, Fire Brick, etc.)
- Band visibility and display style
- Calculation method: ATR or Standard Deviation scaling
These options enable traders to fine-tune the indicator for various market environments and personal trading preferences.
Conclusion
The Regression Trend Channel Indicator for MetaTrader 4 is a robust technical analysis tool based on linear regression. It identifies trend direction, dynamic support/resistance levels, and provides actionable trade setups. By combining its centerline with upper and lower channel bands, the indicator helps traders capture both trend continuation opportunities and reversal points.
Its adaptability—through ATR and standard deviation scaling—makes it highly versatile for trading strategies across forex, stocks, and cryptocurrency markets.