Its core objective is to pinpoint precise areas where the market is most likely to reverse, achieved through a rigorous analysis of market swing points and Fibonacci convergence logic.
This indicator does not function as a simple buy/sell signal generator. Instead, it serves as an intelligent visual guide to market structure, dynamically illustrating significant support and resistance levels as clearly defined green (demand) and red (supply) zones.
https://cdn.tradingfinder.com/file/4...4-by-tflab.zip
https://www.cryptocraft.com/thread/1...-supply-demand
https://www.forexfactory.com/thread/...-in-metatrader
Prop Firm DrawDown Protector : Prop Firm Capital Protection Expert MT4 | Forex Money Management: Forex Trade Management Expert MT4 |ICT Concepts Indicator MT4 | Smart Money Concepts Expert MT4| Smart Money Trap Scanner | Get a free Expert Advisor license via Telegram and WhatsApp
Key Features and Categorization of the DTFX Algo Zones Indicator
This powerful tool is designed for traders seeking a deeper understanding of market dynamics. It is expertly categorized across several key areas:
- Primary Category: Support & Resistance MT4 Indicators
- Function: Trading Assist MT4 Indicators and Levels MT4 Indicators
- Strategy Type: Breakout and Reversal MT4 Indicators
- Platform: Exclusive to MetaTrader 4
- Recommended Skill Level: Intermediate
- Optimal Timeframe: Multi-Timeframe Analysis
- Trading Style: Ideal for Intraday Trading
- Compatible Markets: Forex, Cryptocurrency, and Stock Market MT4 Indicators
The Advanced Algorithm Behind the Zones
The colored zones generated by the DTFX Algo Zones Indicator are not arbitrary. They are the product of a sophisticated blend of technical components and advanced algorithmic processing:
- Swing Point Detection: The algorithm systematically identifies valid price reversals to extract true supply and demand areas.
- Fibonacci Overlap Reinforcement: Zone strength is significantly enhanced through alignment with key Fibonacci retracement levels (50%, 61.8%, and 78.6%) from recent price swings.
- Price Action Analysis: Each zone is evaluated for accuracy based on the presence of candlestick reversal patterns, momentum shifts, and the intensity of the price's reaction upon entry.
- Advanced Algorithmic Filter: A built-in filter automatically removes weak or low-probability zones, ensuring only the most significant levels are displayed, which enhances trading precision.
- Dynamic Visual Display: The indicator intuitively varies the color intensity and transparency of each zone to provide a clear visual representation of its perceived strength and validity.
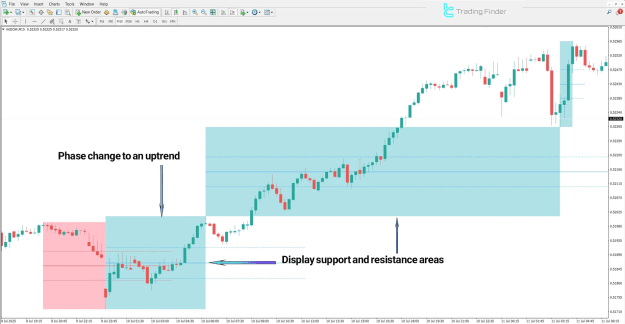
Trading an Uptrend with the Indicator
Scenario: The AUD/CHF currency pair on a 15-minute chart is established in a clear uptrend.
Trading Execution: A high-probability long trade entry is identified as the price action touches a solid DTFX demand (green) zone. The entry is triggered upon the emergence of confirmed bullish signals within the zone.
Bullish Confirmation Signals Include:
- Formation of bullish candlestick patterns (e.g., hammers, engulfing patterns).
- Candlesticks exhibiting long lower shadows, indicating buying pressure.
- A breakout above a local downtrend line.
- A noticeable spike in trading volume.
The confluence of a DTFX demand zone with these additional technical confirmations defines a robust long-term buying opportunity.
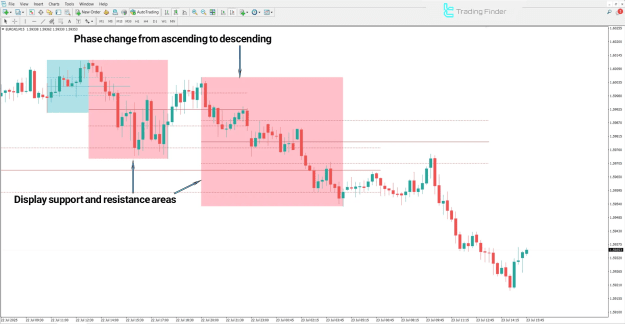
Trading a Downtrend with the Indicator
Scenario: The EUR/CAD pair on a 15-minute chart is engaged in a sustained downtrend.
Trading Execution: A prime short trade opportunity emerges as the price enters a DTFX supply (red) zone, activating selling pressure.
Bearish Confirmation Signals Include:
- Appearance of bearish reversal patterns like bearish engulfing candles or shooting stars.
- Candlesticks with long upper shadows, signaling rejection of higher prices.
- The presence of the zone near a key descending trendline.
When this bearish price reaction coincides with a respected Fibonacci level, the zone's reliability is greatly increased, offering an ideal sell entry point and often indicating a phase shift in market sentiment.
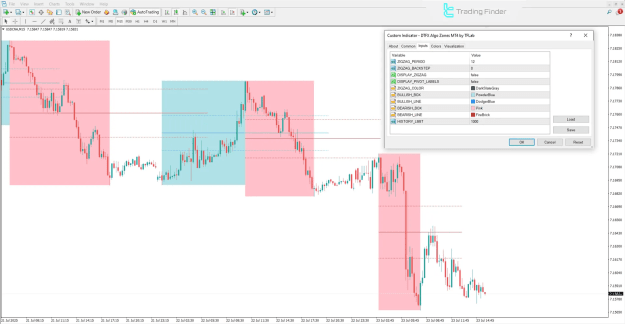
Configuring the DTFX Algo Zones Settings
The indicator offers a comprehensive settings panel for customization, allowing traders to tailor it to their specific strategy:
- ZIGZAG PERIOD: Adjusts the sensitivity for swing point detection.
- ZIGZAG BACKSTEP: Sets the minimum price movement required to form a new swing point.
- DISPLAY ZIGZAG: Toggles the visibility of the Zigzag line on the chart.
- DISPLAY PIVOT LABELS: Controls the display of labels for identified pivot points.
- ZIGZAG COLOR: Allows customization of the Zigzag line's color.
- BULLISH BOX/LINE: Configures the appearance of the demand zone boxes and their borders.
- BEARISH BOX/LINE: Configures the appearance of the supply zone boxes and their borders.
- HISTORY LIMIT: Defines how many historical bars the indicator analyzes to draw zones.
Conclusion
The DTFX Algo Zones Indicator is a powerful professional tool designed to detect high-probability supply and demand zones. By integrating price action, Fibonacci confluence, and a smart algorithmic filter, it provides unparalleled clarity into market structure.
This tool excels in highlighting the most critical areas for potential reversals without cluttering the chart, enabling intermediate to advanced traders to make more informed and precise trading decisions.