https://cdn.tradingfinder.com/file/3...4-by-tflab.zip
https://www.forexfactory.com/thread/...-in-metatrader
Prop Firm DrawDown Protector : Prop Firm Capital Protection Expert MT4 | Forex Money Management: Forex Trade Management Expert MT4 |ICT Concepts Indicator MT4 | Smart Money Concepts Expert MT4| Smart Money Trap Scanner | Get a free Expert Advisor license via Telegram and WhatsApp
Key Features and Applications
This versatile analytical tool is categorized under Oscillators, Volatility, and Trend Indicators. It's suitable for intermediate traders and functions across multiple timeframes, making it a Multi-Timeframe MT4 Indicator. Its applications span a wide range of financial instruments, including:
- Forex
- Cryptocurrency
- Share Stocks
- Stock Market
The indicator is particularly effective for intraday trading and is often used to identify reversal signals.
Trading Signals: Uptrend and Downtrend Conditions
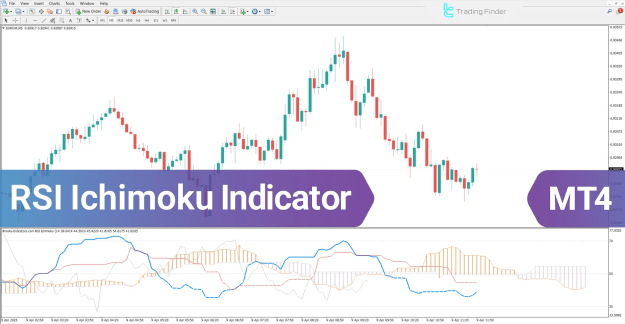
The RSI Ichimoku Indicator excels at identifying potential trading opportunities by analyzing the interaction between the RSI line and the Ichimoku Cloud (Kumo).
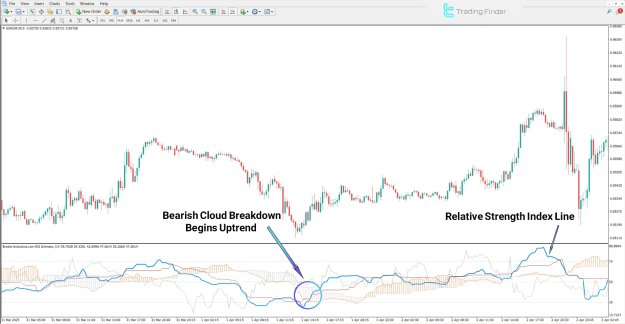
Uptrend Conditions: When the RSI line breaks through a bearish Kumo cloud, it often signals a decrease in selling pressure and the potential end of a downtrend. This creates a favorable Buy opportunity. For instance, in a 5-minute EUR/CHF chart, a clear upward break of the RSI line through the cloud can serve as a strong bullish signal.
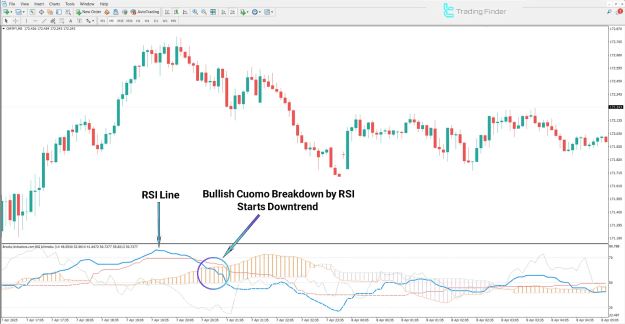
Downtrend Conditions: Conversely, a potential Sell opportunity arises when the RSI line breaks down through a bullish Kumo cloud. This action indicates overbought conditions and suggests that a reversal may be imminent. This signal is particularly useful for identifying bearish trends, as seen in a 5-minute CHF/JPY chart.
Indicator Settings and Customization
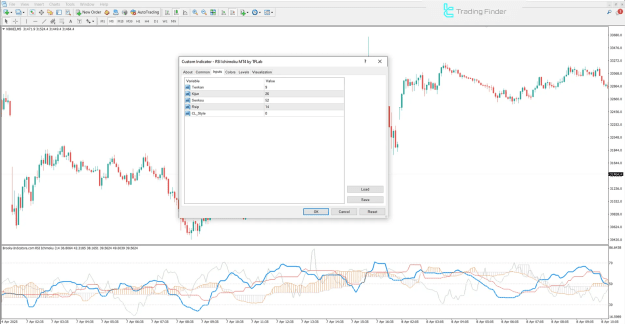
Traders can adjust the parameters of the RSI Ichimoku Indicator to suit their specific strategies. The settings panel includes options for the following components:
- Tenkan: The Tenkansen line, a key component of the Ichimoku system.
- Kijun: The Kijunsen line, another core Ichimoku line.
- Senkou: The Senkou lines (Senkou Span A and B) that form the Ichimoku Cloud.
- Rsip: Parameters related to the RSI indicator, such as its period.
- CL-Style: Customization for the display style of the lines and components.
Conclusion
By integrating the Relative Strength Index and the Ichimoku system, the RSI Ichimoku Indicator delivers more precise entry and exit signals. This comprehensive trading tool not only identifies overbought and oversold zones but also helps traders determine trend direction and identify key support and resistance levels, providing a holistic view of market dynamics.