Traders utilize various specialized charts—such as Heiken Ashi, Renko, and Bar charts—to filter out market noise and enhance analytical precision, a key lesson in any Forex Education curriculum. The smallest error in trend or signal recognition can result in the loss of the entire invested capital, highlighting the practical importance of this education. Therefore, proficient chart reading, a central pillar of Forex Education, is the art of synthesizing price action, key level analysis, and candlestick behavior across different charting frameworks.
Prop Firm DrawDown Protector : Prop Firm Capital Protection Expert MT4 | Forex Money Management: Forex Trade Management Expert MT4 |ICT Concepts Indicator MT4 | Smart Money Concepts Expert MT4| Smart Money Trap Scanner | Get a free Expert Advisor license via Telegram and WhatsApp
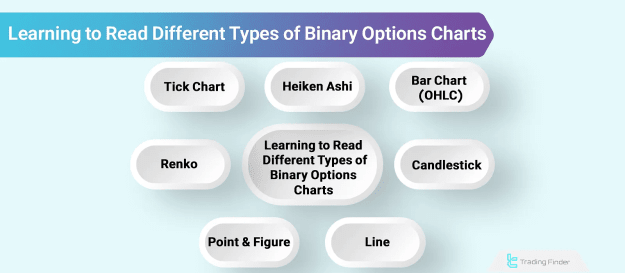
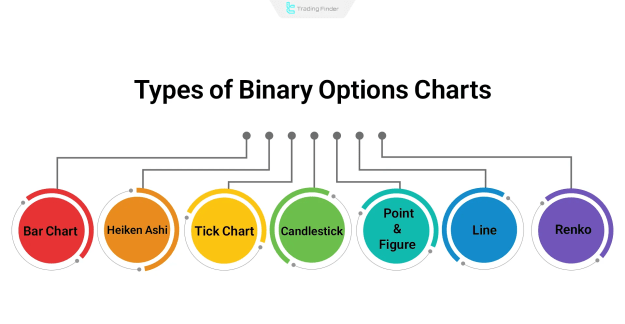
Core Types of Binary Options Charts
The selected price chart is not merely a visual aid; it is the primary lens for technical analysis. Each chart type—from Candlestick to Point & Figure—offers a unique perspective on price action and market trend dynamics, enabling more informed trading decisions.
The essential suite of Binary Options Charts includes:
- OHLC / Bar Chart
- Candlestick Charts
- Line Charts
- Heiken Ashi
- Renko Chart
- Point & Figure
- Tick Chart
Bar Chart (OHLC Chart)
This chart type represents each time period with a single bar that encapsulates four critical data points: Open, High, Low, and Close (OHLC). The vertical line defines the total price range, while the left and right horizontal ticks mark the opening and closing prices, respectively.
Professional Application in Binary Options:
Bar charts excel as a filter against weak and false breakouts. Their professional applications include:
- Scrutinizing real-time price behavior for short-expiry trades (60 seconds to 2 minutes).
- Identifying genuine breakouts at support or resistance zones by analyzing the bar's closing price relative to its high and low.
- Combining with momentum indicators (e.g., EMA 50 or 200) to confirm trend strength prior to entry.
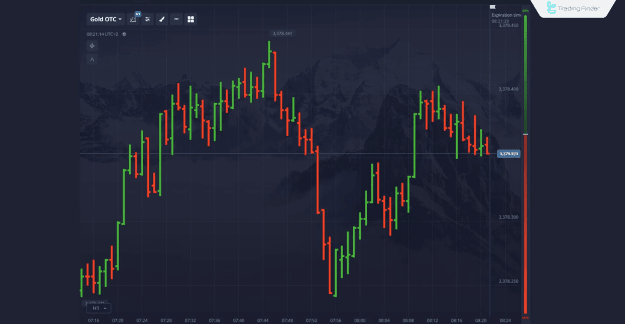
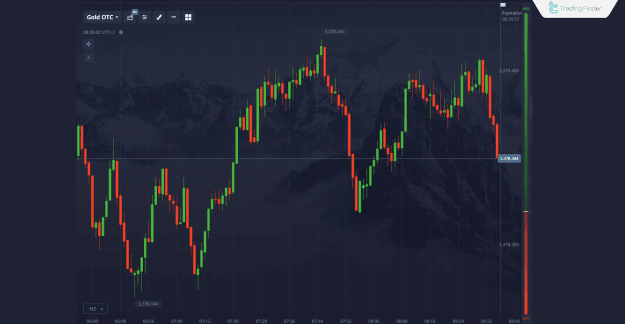
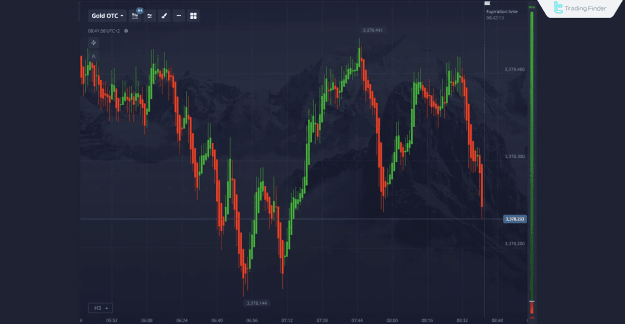
Candlestick Charts
As the most prevalent charting method, candlestick charts provide deep insight into market psychology. Each candle consists of a body (open-to-close range) and wicks (high/low extremes). The body's color直观地 indicates price direction, making this chart supremely suitable for price action analysis.
Professional Application in Binary Options:
Candlesticks form the bedrock of most price action strategies. Key applications are:
- Identifying potent reversal patterns (Pin Bar, Engulfing, Doji) within key support/resistance areas on M1 and M5 timeframes.
- Executing precise entries for turbo options based on these patterns.
- Confirming signals with oscillators like RSI or Stochastic on the same low-timeframe candle.
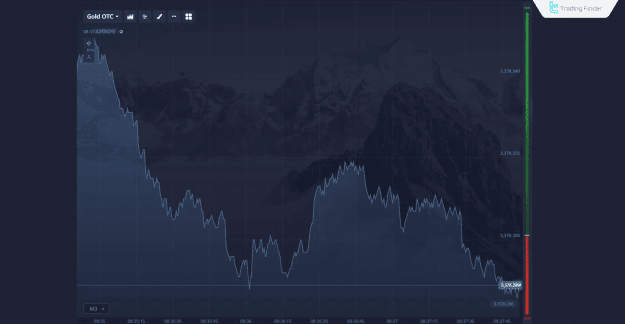
Line Charts
The most simplified chart, a line chart connects the closing prices of consecutive periods into a continuous line. This simplification offers a clear, undistracted view of the overarching market trend by eliminating minor fluctuations and noise.
Professional Application in Binary Options:
Line charts serve as an efficient tool for high-level trend analysis. Traders use them to:
- Quickly ascertain the general market direction on higher timeframes (M15, M30) before initiating shorter-term trades.
- Analyze clean trend transitions following major economic news releases, free from the distraction of candlestick wicks.
- Identify clear trend continuation zones for entering Call or Put trades in the dominant direction.
Heiken Ashi Charts
Heiken Ashi is a modified candlestick chart that uses averaged price data to create a smoother, more streamlined visual representation of the trend. Its primary function is to filter out market noise, making trend identification and continuation significantly easier.
Professional Application in Binary Options:
Heiken Ashi charts are ideal for trend-following strategies. Their applications include:
- Entering trades confidently in the direction of a strong, established trend.
- Avoiding false entries during short-lived corrective phases or periods of consolidation.
- Suiting trades with longer expiry times (10 minutes to 1 hour) and being combined with tools like Bollinger Bands for confirmation.
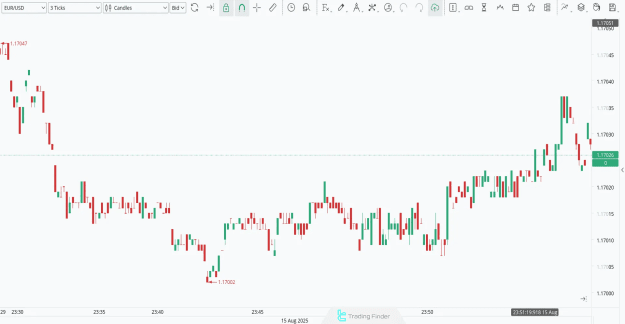
Tick Charts
A Tick Chart is unique as it is constructed based on the number of trades (ticks) executed, not on the passage of time. A new bar forms after a predetermined number of transactions occur, providing a pure view of market activity and liquidity.
Professional Application in Binary Options:
Tick charts are the tool of choice for high-frequency scalping. Professionals use them to:
- Execute scalping strategies on high-volume pairs (e.g., EUR/USD) during peak market sessions.
- Manage ultra-short expiry trades (under 30 seconds) by reacting to pure transaction volume.
- Combine with fast-acting indicators like the Parabolic SAR for rapid entry signals.
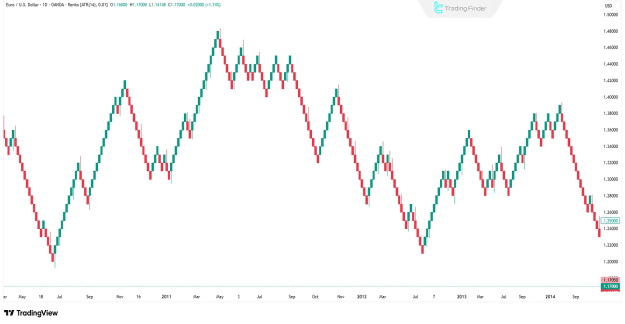
Renko Charts
Renko Charts are built solely on price movement, completely disregarding time. These "bricks" only form when price moves a predetermined amount, filtering all minor movements and providing a crystal-clear depiction of the underlying trend.
Professional Application in Binary Options:
Renko charts help traders focus on significant price moves. Applications are:
- Filtering out insignificant noise to concentrate on substantial price changes and stable trends.
- Setting the brick size based on market volatility using the ATR indicator.
- Identifying major reversal points with high clarity, devoid of timeframe-related distractions.
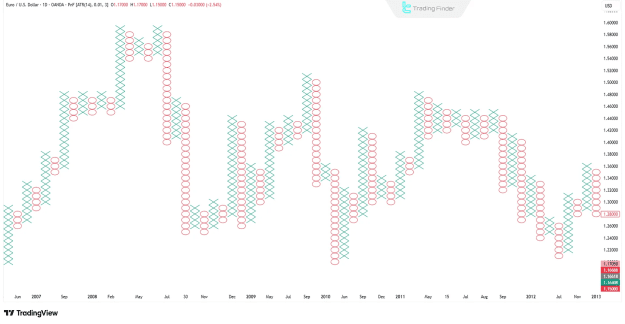
Point & Figure Charts
This classical charting method plots price movements without time, using columns of X's (for rising prices) and O's (for falling prices). It is exceptionally effective for identifying critical support and resistance levels and validating breakouts.
Professional Application in Binary Options:
Point & Figure charts are used for strategic level analysis. Traders apply them to:
- Detect and avoid false breakouts that may appear on other chart types.
- Identify robust support and resistance zones with a high degree of accuracy.
- Focus purely on price structure, often combining analysis with volume indicators for breakout confirmation.
How to Read Binary Options Charts: A Step-by-Step Framework
Effective chart reading is a systematic process that synthesizes trend, level, and timing. To harness charts for binary options success, adhere to this professional framework:
Step 1: Define the Market Structure
Determine the market's direction by analyzing successive highs and lows. An uptrend is characterized by Higher Highs and Higher Lows, a downtrend by Lower Highs and Lower Lows, and a range by sideways movement. All trading decisions must align with this identified structure.
Step 2: Pinpoint Key Levels
Identify and mark crucial support and resistance zones, supply and demand areas, and daily highs/lows. These are the price levels where reactions are most probable, offering high-probability entry points with optimal risk-to-reward ratios.
Step 3: Select the Optimal Chart Type
Align your chart choice with your trading strategy:
- Price Action & Patterns: Candlestick Charts
- Trend Clarity: Heiken Ashi Charts
- Noise Filtering: Renko Charts
- Quick Level Drawing: Line Charts
Step 4: Analyze Candlestick Behavior and Patterns
Decode the story told by candles. A long body indicates strong momentum, while long wicks signify rejection at a price level. Remember, patterns like Pin Bars or Engulfing patterns are only valid when they occur at the key levels identified in Step 2.
Step 5: Integrate Technical Indicators
Use indicators as confirming tools, not primary signals. The RSI is excellent for spotting divergences, Bollinger Bands define ranges and breakouts, and Moving Averages confirm trend direction and dynamic support/resistance.
Step 6: Determine the Appropriate Expiry Time
Your expiry should logically match your signal's timeframe. A good rule is to set an expiry 1 to 2 times the length of your signal candle. For instance:
- M1 signals: 60–120 seconds expiry.
- M5 signals: 5–10 minutes expiry.
This allows the anticipated price move sufficient time to fully develop and conclude.
Sources for Binary Options Charts
Traders can access charts through two primary sources, each with distinct advantages.
Downloadable Professional Platforms
These software solutions offer deep customization, historical data, and advanced tools.
- MetaTrader 4 (MT4) & MetaTrader 5 (MT5): The industry standards for Forex and binary analysis, supporting countless indicators and automated scripts.
- NinjaTrader: A powerful platform favored by professional traders for advanced analysis and strategy execution.
- MultiCharts: Designed for professionals requiring multiple data feeds and robust backtesting capabilities.
Online Web-Based Platforms
These browser-based tools offer convenience and accessibility without installation.
- TradingView: A premier online charting platform featuring social sharing, customizable indicators, and a powerful scripting language.
- Investing.com Charts: Provides live charts for a vast array of assets including Forex, indices, and cryptocurrencies.
- CoinMarketCap / CoinGecko: Essential resources for dedicated cryptocurrency traders, offering price tracking and charts for thousands of tokens.
Conclusion
In binary options trading, where outcomes are absolute, mastery in reading charts is what separates profitability from loss. Each chart type delivers unique intelligence: Candlesticks reveal market sentiment, Heiken Ashi smooths trends, Renko filters noise, and Point & Figure validates levels.
A professional trader does not merely look at charts; they read them through a structured process—deciphering market structure, honoring key levels, selecting the right chart tool, analyzing its components, and timing the expiry correctly. This disciplined approach to chart analysis is the cornerstone of consistent success in the binary options market.