You can access the indicator from this link:
https://tradingfinder.com/products/i...twitter-model/
You can access the indicator on the TradingView website:
https://www.tradingview.com/script/0...G-M15-MSS-SMT/
Prop Firm DrawDown Protector : Prop Firm Capital Protection Expert MT4 | Forex Money Management: Forex Trade Management Expert MT4 |ICT Concepts Indicator MT4 | Smart Money Concepts Expert MT4| Smart Money Trap Scanner | Get a free Expert Advisor license via Telegram and WhatsApp
Key Features of the Twitter Model ICT Indicator
- Dual-Direction Functionality – Adapts seamlessly to both bullish and bearish market conditions.
- ICT-Based Analysis – Utilizes ICT concepts such as CISD (Change in State of Delivery) to validate trade entries.
- Liquidity Zone Detection – Tracks the Previous Day’s High (PDH) and Previous Day’s Low (PDL) to identify potential liquidity sweeps.
- Fair Value Gap (FVG) Integration – Highlights premium entry zones based on price imbalances.
- Intraday Precision – Optimized for short-term timeframes (1 minute to 4 hours).
- Multi-Market Application – Suitable for forex, cryptocurrency, and other highly liquid markets.
Trading Strategy Overview
The Twitter Model ICT Indicator is a liquidity-driven system designed to analyze price action in relation to PDH and PDL.
It blends liquidity sweep detection with the Fair Value Gap (FVG) concept, enabling traders to improve timing and accuracy in their entries.
This combination provides a robust framework for market structure analysis and liquidity zone assessment.
Example Setups
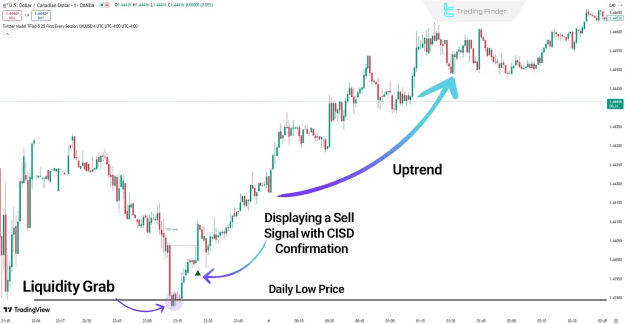
![]() Bullish Setup (USD/CAD, 1-Minute Chart)
Bullish Setup (USD/CAD, 1-Minute Chart)
- Liquidity is taken below the Previous Day’s Low (PDL).
- Price reclaims the daily range, triggering a buy signal after CISD confirmation.
- Market structure shifts upward, confirming bullish intent.
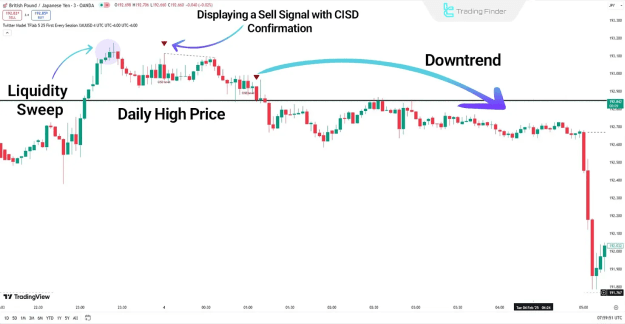
![]() Bearish Setup (GBP/JPY, Downtrend)
Bearish Setup (GBP/JPY, Downtrend)
- Liquidity is absorbed above the Previous Day’s High (PDH).
- Price returns inside the daily range, generating a sell signal upon CISD confirmation.
- Structure aligns with bearish continuation.
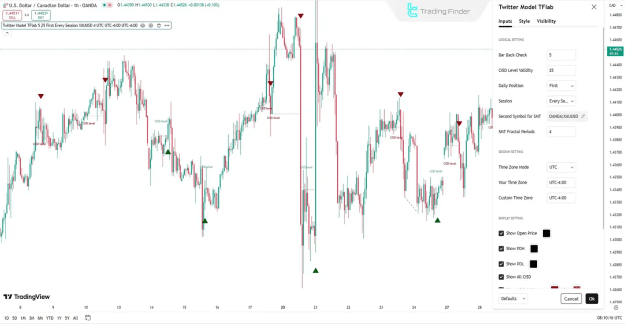
Customization and Settings
Logical Settings
- Bar Back Check – Defines the number of previous candles used for CISD validation.
- CISD Level Validity – Sets the duration for which a CISD level remains active.
- Daily Position – Aligns trades with the daily directional bias.
- Session – Chooses active trading sessions.
- Second Symbol for SMT – Enables divergence comparison with another asset.
- SMT Fractal Periods – Adjusts fractal count for SMT analysis.
Session Settings
- Time Zone Mode – Switch between system or custom time zone.
- Your Time Zone – Sets a default zone for the trader.
- Custom Time Zone – Configures session display for specific regions.
Display Settings
- Show Open Price – Marks daily open price on the chart.
- Show PDH/PDL – Displays the previous day’s high and low.
- Show All CISD – Enables visibility of all CISD levels.
- Show High/Low CISD Names – Labels CISD levels for clarity.
- SMT Divergence Display – Toggles divergence lines and labels.
Conclusion
The Twitter Model ICT Indicator is a comprehensive solution for traders seeking precise market insights.
By combining Market Structure (MS), Liquidity Zones, Fair Value Gap detection, and CISD confirmations, it allows traders to:
- Detect liquidity grabs.
- Confirm structural shifts.
- Execute trades with increased accuracy in both bullish and bearish markets.
This makes it particularly effective for intraday trading and short-term liquidity strategies across forex, crypto, and global financial markets.