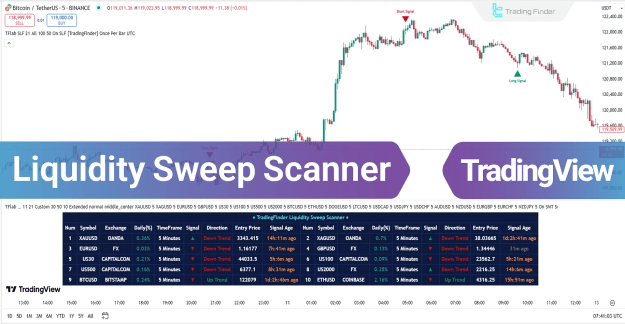
In addition to detecting potential reversals, the scanner highlights areas where trend continuation is likely. It provides real-time trading signals through green (buy) and red (sell) arrows, along with a dynamic data box displaying:
- Price change percentage
- Selected time frame
- Trend direction
- Current price
- Time elapsed since the last signal
You can access the Indicator from this link:
https://tradingfinder.com/products/i...sweep-scanner/
You can access the Indicator on the TradingView website:
https://www.tradingview.com/script/l...TradingFinder/
Prop Firm DrawDown Protector : Prop Firm Capital Protection Expert MT5 |Forex Money Management: Forex Trade Management Expert MT5 | ICT Concepts Indicator MT5 |Smart Money Concepts Expert MT5 | Smart Money Trap Scanner |Get a free Expert Advisor license via Telegram and WhatsApp
Key Features & Specifications
The Liquidity Sweep Scanner falls under multiple indicator categories, including:
- ICT TradingView Indicators
- Smart Money TradingView Indicators
- Liquidity TradingView Indicators
Compatibility & Trading Applications
- Platform: TradingView
- Skill Level: Advanced
- Indicator Type: Reversal & Multi-Timeframe
- Trading Style: Intraday
- Markets Supported:
- Forex
- Cryptocurrencies
- Stocks
- Commodities
- Indices
How the Liquidity Sweep Scanner Works
The scanner operates based on three critical components:
1. Identifying Swing Points
- Detects valid Swing Highs and Lows, which are liquidity accumulation zones.
- These levels often contain stop-loss clusters, making them crucial for market reversals.
2. Defining the Reaction Zone
- The area between the swing point and the highest/lowest open/close price of the candle.
- Price often retests this zone before deciding its next move.
3. Checking for Liquidity Sweep
- Analyzes whether a breakout is genuine or just a liquidity grab.
- Helps filter false breakouts and improves trade accuracy.
4. Confirmation Candle Recognition
- Dojis or small-bodied candles in the reaction zone indicate potential reversals.
- These patterns signal failed breakouts, increasing the probability of a trend reversal.
Scanner Behavior in Different Market Conditions
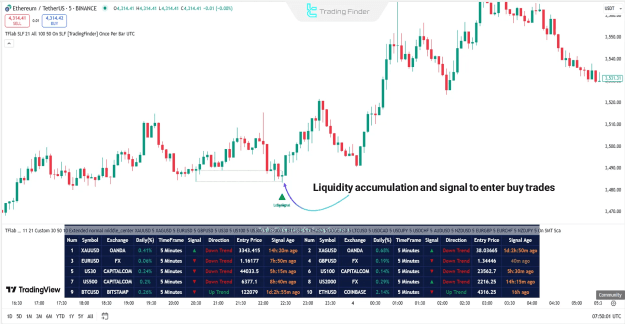
Uptrend Scenario
- Identifies a Swing Low and marks the reaction zone.
- Price retests the zone, creating a liquidity sweep.
- A confirmation candle (e.g., Doji) signals buyer weakness.
- A green arrow appears, indicating a buy entry.
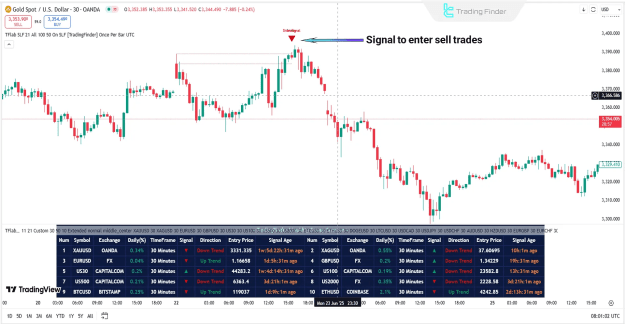
Downtrend Scenario
- Detects a Swing High where buyers' liquidity is concentrated.
- Price retests the reaction zone but fails to sustain above it.
- A bearish confirmation candle (e.g., Doji) suggests seller dominance.
- A red arrow appears, signaling a sell entry.
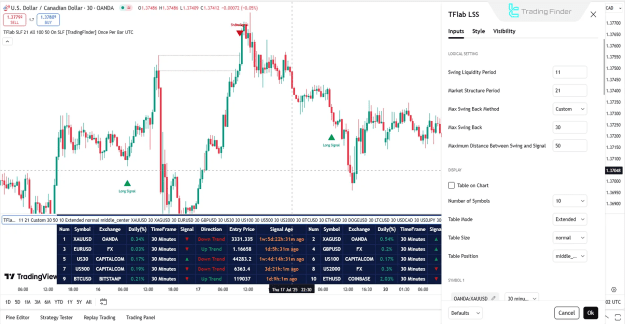
Customizable Scanner Settings
The Liquidity Sweep Scanner offers adjustable parameters for optimal performance:
Logical Settings
- Swing Liquidity Period: Adjusts swing detection sensitivity.
- Market Structure Period: Defines structure visibility.
- Max Swing Back: Limits swing-back iterations.
- Maximum Distance Between Swing and Signal: Controls signal relevance.
Display Options
- Table on Chart: Toggles real-time data visibility.
- Number of Symbols: Supports up to 20 trading symbols.
- Table Position & Size: Customizes layout.
Alert Settings
- Alert Notifications: Enables/disables alerts.
- Message Frequency: Sets alert repetition.
- Time Zone Display: Adjusts alert timestamps.
Note: Users can select their preferred timeframe, applied uniformly across all symbols.
Conclusion
The Liquidity Sweep Scanner is a powerful tool for traders seeking high-probability reversal zones. By combining liquidity analysis, market structure, and confirmation candles, it minimizes false signals and enhances trade accuracy. Whether trading forex, crypto, or stocks, this scanner provides low-risk, high-reward opportunities in dynamic markets.