The indicator highlights divergences directly on the chart with colored lines and markers, while a real-time information table provides detailed divergence statistics for quick and informed decision-making.
You can access the Indicator from this link:
https://tradingfinder.com/products/i...me-divergence/
You can access the Indicator on the TradingView website:
https://www.tradingview.com/script/b...-Vol-Reversal/
Prop Firm DrawDown Protector : Prop Firm Capital Protection Expert MT5 | Smart Money Trap Scanner | Forex Money Management: Forex Trade Management Expert MT5 | ICT Concepts Indicator MT5 |Smart Money Concepts Expert MT5 |Get a free Expert Advisor license via Telegram and WhatsApp
Key Features of the OBV Divergence Indicator
The OBV Divergence Indicator is designed for traders who want a reliable tool to spot momentum shifts between price action and On Balance Volume (OBV). By combining visual signals with detailed data, it provides precise insights for improved trading execution.
Core Functionalities
- Real-time detection of bullish and bearish divergences between price and OBV
- Color-coded plotting: green lines for bullish divergence, red lines for bearish divergence
- Comprehensive on-chart table displaying divergence strength, recurrence, and quality
- Multi-timeframe compatibility for flexible analysis
- Versatility across markets: Forex, cryptocurrencies, stocks, indices, and commodities
Indicator Classification and Application
- Indicator Categories:
- Signal & Forecast TradingView Indicators
- Currency Strength TradingView Indicators
- Trading Assist Tools
- Platform: TradingView
- Skill Level: Intermediate
- Indicator Type: Reversal Indicator
- Timeframe Compatibility: Multi-Timeframe
- Trading Style: Intraday
- Market Suitability:
- Forex
- Cryptocurrencies
- Stocks
- Commodities
- Indices
- Share Markets
Indicator Display and Functionality
Real-Time Divergence Table
The indicator includes an on-chart table that delivers essential divergence information in real time:
- Type Divergence – Identifies bullish or bearish signals
- Exist – Highlights current divergence with a “+” symbol
- Consecutive – Tracks the number of back-to-back divergences
- Divergence Quality – Rates the strength and reliability of the divergence
- Change Phase – Shows the transition between OBV peaks and troughs
This structured data helps traders validate signals and time their trades with greater confidence.
Divergence Types
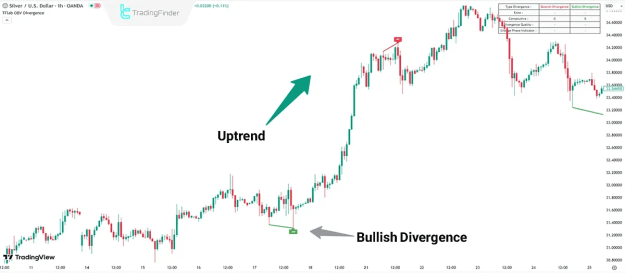
Bullish Divergence (Positive)
- Occurs when OBV rises while price makes a lower low
- A green line is plotted to mark the bullish divergence
- Suggests increasing buying pressure and a potential trend reversal to the upside
- The signal becomes more reliable once momentum confirms the reversal
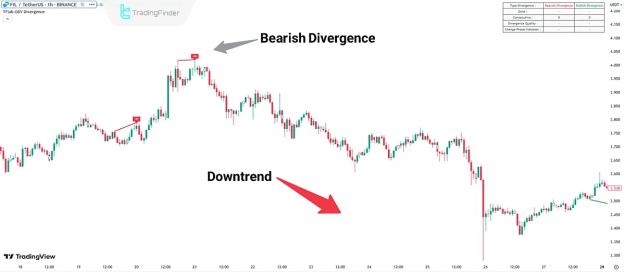
Bearish Divergence (Negative)
- Occurs when OBV falls while price makes a higher high
- A red line is plotted to highlight the bearish divergence
- Indicates weakening buying strength and a possible downtrend initiation
- Acts as a sell signal when price action aligns with volume weakness
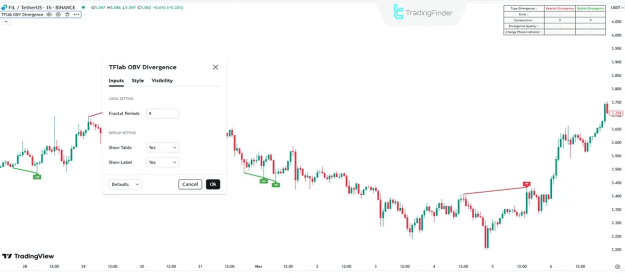
Indicator Settings
Logical Settings
- Fractal Period – Defines the number of bars used to identify divergences (Default: 4)
Display Settings
- Show Table – Toggles the real-time divergence information table
- Show Label – Displays divergence type and location directly on the chart
These customizable settings allow traders to tailor the indicator to their preferred trading style and charting layout.
Conclusion
The OBV Divergence Indicator is a powerful, volume-based tool for identifying potential market reversals. By analyzing the relationship between price and OBV, it pinpoints areas of imbalance where trend shifts are most likely to occur.
With its combination of bullish and bearish divergence detection, real-time signal tables, and broad market compatibility, the indicator enhances accuracy in both intraday and swing trading strategies.