You can access the indicator from this link:
https://tradingfinder.com/products/i...ilure-pattern/
You can access the indicator on the TradingView website:
https://www.tradingview.com/script/P...-ICT-Strategy/
Prop Firm DrawDown Protector : Prop Firm Capital Protection Expert MT4 | Forex Money Management: Forex Trade Management Expert MT4 |ICT Concepts Indicator MT4 | Smart Money Concepts Expert MT4| Smart Money Trap Scanner | Get a free Expert Advisor license via Telegram and WhatsApp
By detecting these patterns, the SFP Indicator helps traders:
- Recognize market manipulations by institutions
- Align trades with dominant trends
- Avoid common traps in volatile markets
Key Features of the SFP Indicator
- False Breakout Detection
- Spots failed swings at recent highs and lows.
- Confirms when price cannot sustain past a liquidity zone.
- Liquidity Sweep Visualization
- Highlights zones where stop-loss orders are likely triggered.
- Helps traders anticipate institutional accumulation or distribution.
- Reversal Signals
- Provides buy/sell signals based on rejection candles.
- Uses arrows and color-coded lines to mark entry points clearly.
- Swing Point Marking
- Color-coded lines display recent swing highs and lows.
- Facilitates quick recognition of key levels for trade planning.
- Multi-Timeframe Support
- Works across timeframes for intraday, swing, and long-term analysis.
- Allows traders to confirm setups on higher or lower timeframes.
Markets & Compatibility
- Platform: TradingView
- Skill Level: Intermediate
- Indicator Type: Reversal / Liquidity Pattern Indicator
- Trading Style: Intraday, Reversal, Swing Trading
- Applicable Markets:
- Forex
- Cryptocurrencies
- Stocks
- Commodities
How the SFP Indicator Works
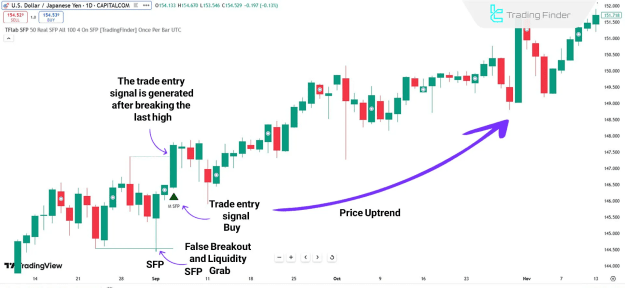
Uptrend Scenario
- Example: USD/JPY Daily Chart
- Price dips briefly below a key support (recent low) with a wick.
- Fails to close below the level → false breakout.
- Stop-loss orders below the support are triggered, causing a temporary liquidity grab.
- Price reverses upward, often continuing the trend.
- Green arrow signals a potential buy entry.
This identifies a liquidity grab followed by bullish continuation, allowing traders to enter the market at optimal reversal points.
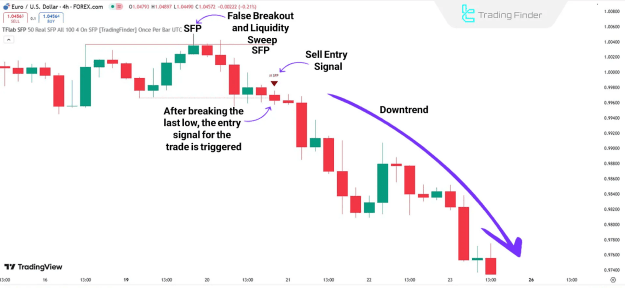
Downtrend Scenario
- Example: EUR/USD Daily Chart
- Price briefly breaches a resistance level (recent high).
- Cannot sustain the move → false breakout.
- Liquidity above the high is absorbed, triggering a sharp downward move.
- Red arrow signals a potential sell entry.
This confirms bearish momentum after a liquidity sweep.
Indicator Display & Signal Markers
- Green lines/arrows: Bullish swing failure – buy opportunities
- Red lines/arrows: Bearish swing failure – sell opportunities
- Swing highs/lows: Clearly marked to show reversal zones
- Signal timing: Based on confirmation of false breakout and price reversion
These visual markers simplify spotting high-probability trade setups and improve reaction time during fast-moving markets.
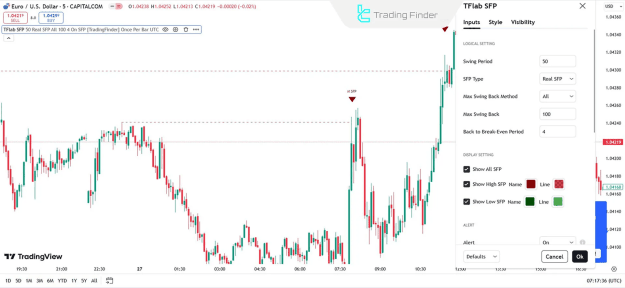
Configuration & Customization
Logical Settings
- Swings Period: Number of bars to detect swing highs/lows (default: 50)
- SFP Type: Choose false breakout at highs or lows
- Max Swing Back Method: Determines how far the price can reverse from breakout
- Max Swing Back: Sets maximum reversal distance
- Back-to-Break-Even Period: Defines the timeframe for price to return near entry point
Display Settings
- Show all SFPs
- Show only high SFPs (red)
- Show only low SFPs (green)
Alert Settings
- Real-time alert activation
- Custom alert names
- Adjustable message frequency
- Alert time configurable by timezone
These settings give traders full control over how signals appear and how they are notified, allowing seamless integration into any trading workflow.
Practical Applications of the SFP Indicator
- Liquidity Grab Detection: Recognize where stop-loss hunting occurs to anticipate market manipulation.
- Optimal Entry Points: Enter trades near reversal zones with minimal risk.
- Trend Confirmation: Align trades with the prevailing trend after liquidity sweeps.
- Risk Management: Helps avoid false breakouts that mislead retail traders.
- Versatile Trading: Works for intraday scalping, swing trading, and multi-timeframe analysis.
Conclusion
The Swing Failure Pattern (SFP) Indicator is an essential tool for traders using ICT (Inner Circle Trader) strategies, Smart Money Concepts (SMC), and liquidity-based trading methods. By identifying false breakouts at significant market levels, it provides:
- Clear visual signals for entries and exits
- Detection of stop-loss hunts and liquidity grabs
- Improved accuracy in both intraday and swing trading
With precise logic, visual clarity, and customizable alerts, the SFP Indicator empowers traders to make informed decisions, avoid traps, and capitalize on institutional market behavior.