You can access the Indicator from this link:
https://tradingfinder.com/products/i...uidity-finder/
You can access the Indicator on the TradingView website:
https://www.tradingview.com/script/K...uidity-Finder/
Prop Firm DrawDown Protector : Prop Firm Capital Protection Expert MT5 |Forex Money Management: Forex Trade Management Expert MT5 | ICT Concepts Indicator MT5 |Smart Money Concepts Expert MT5 | Smart Money Trap Scanner |Get a free Expert Advisor license via Telegram and WhatsAp
Key Features and Functionality
The Liquidity Finder Indicator helps traders visualize these critical zones using dashed lines on a chart. Its primary function is to highlight areas where significant liquidity is likely to be accumulated.
- Indicator Categories: The tool is classified under several key categories, including ICT Tradingview Indicators, Smart Money Tradingview Indicators, and Liquidity Tradingview Indicators.
- Skill Level: It is best suited for traders with advanced trading skills due to its focus on sophisticated market dynamics.
- Indicator Type: It is considered a Reversal Tradingview Indicator because price reversals often occur after a liquidity grab.
- Timeframe and Trading Style: The indicator is a Multi-Timeframe Tradingview Indicator and is optimized for Intraday Tradingview Indicators.
- Trading Instruments: This versatile tool can be applied across various financial instruments, including Forex Market, Cryptocurrency, Stock, and Commodity trading.
Identifying Liquidity Zones
The indicator draws liquidity zones based on specific chart patterns where stop-loss orders are concentrated. These zones are typically found at key price levels:
- Above Double Top or Triple Top patterns: This is where traders who are shorting a market often place their stop-loss orders.
- Below Double Bottom or Triple Bottom patterns: This is where traders who are long a market typically place their stop-loss orders.
- Above Bearish Trend Lines: The indicator identifies liquidity above downward-sloping trend lines.
- Below Bullish Trend Lines: It also identifies liquidity below upward-sloping trend lines.
Practical Application in Market Trends
The indicator's usefulness can be seen by examining its application in different market scenarios.
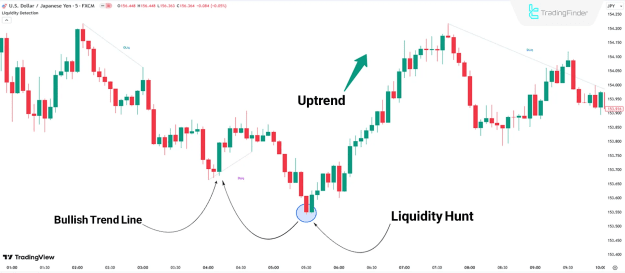
Liquidity Zones in an Uptrend
In an uptrend, the indicator can identify liquidity zones based on bullish trend lines. When the price of an asset, such as the USD/JPY pair, moves below and then "hunts" this liquidity by triggering stop losses, it often leads to a strong upward price movement, confirming the trend's continuation or a shift in market direction.
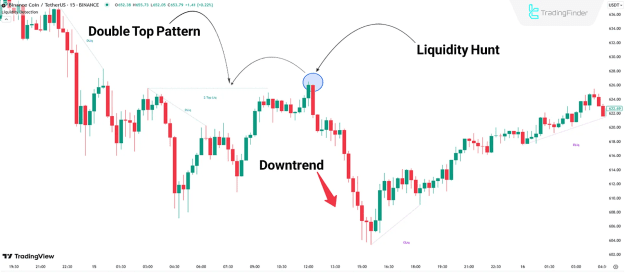
Liquidity Zones in a Downtrend
Similarly, in a downtrend, the indicator highlights areas of liquidity, such as above a double top pattern. When the price of an asset, like Binance Coin (BNB), breaches this zone and triggers a "stop hunt," it can signify a significant reversal, leading to a bearish trend.
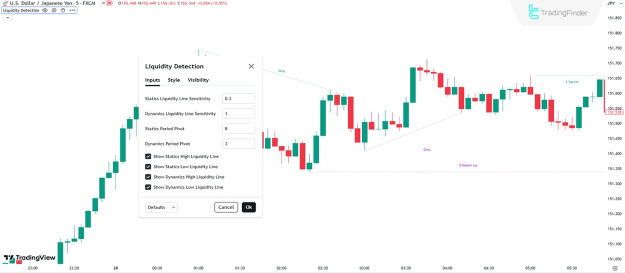
Indicator Settings and Customization
The Liquidity Finder Indicator allows for user customization through its settings to fine-tune its sensitivity and display options. The default settings include:
- Statics Liquidity Line Sensitivity: A value of 0.3 for identifying static liquidity lines.
- Dynamics Liquidity Line Sensitivity: A value of 1 for identifying dynamic liquidity lines.
- Statics Period Pivot: A pivot period of 8 for static lines.
- Dynamics Period Pivot: A pivot period of 3 for dynamic lines.
- Display Options: Toggles to show or hide static and dynamic high and low liquidity lines.
The Liquidity Finder Indicator is a powerful tool for traders who want to gain a deeper understanding of market dynamics by identifying areas of potential price reversals caused by institutional order flow. By visualizing these crucial liquidity zones, traders can align their strategies with the movements of "smart money."
Conclusion
The Liquidity Finder Indicator is an essential tool for advanced traders, helping to identify key liquidity zones based on ICT and Smart Money Concepts. By highlighting areas where stop-loss orders accumulate (such as above double tops or below double bottoms), the indicator helps traders anticipate potential trend reversals or continuations. This valuable tool, available on platforms like TradingView, allows traders to align their strategies with institutional movements and make more informed decisions across various financial markets.