You can access the Indicator from this link:
https://tradingfinder.com/products/i...r-rsi-macd-ao/
You can access the Indicator on the TradingView website:
https://www.tradingview.com/script/2...AO-Oscillator/
Prop Firm DrawDown Protector : Prop Firm Capital Protection Expert MT5 |Forex Money Management: Forex Trade Management Expert MT5 | ICT Concepts Indicator MT5 |Smart Money Concepts Expert MT5 | Smart Money Trap Scanner | Get a free Expert Advisor license via Telegram and WhatsApp
Indicator Specifications and Features
This indicator is an ideal tool for traders with an intermediate skill level and is well-suited for multiple trading styles and instruments.
- Platform: Available on TradingView.
- Categories: Classified under Oscillators, Signal & Forecast, and Trading Assist indicators.
- Skill Level: Designed for Intermediate traders.
- Timeframes: A Multi-Timeframe tool, suitable for use on various chart periods.
- Trading Styles: Effective for both Intraday Trading and Swing Trading.
- Instruments: Compatible with Forex, Cryptocurrency, and Stock markets.
Understanding the Divergence Information Table
A key feature of this indicator is the real-time table that provides a comprehensive overview of detected divergences. The table includes the following data points:
- Type: Specifies whether the divergence is Bullish (positive) or Bearish (negative).
- Exist: Indicates the presence of a divergence with a "+" symbol.
- Consecutive: Shows the number of consecutive divergences, which can be an important factor for signal validity.
- Divergence Quality: A metric that assesses the quality of the divergence based on consecutive occurrences.
- Change Phase: Detects phase changes between two oscillating peaks, providing additional insight into market shifts.
Recognizing Divergence Signals
The indicator helps traders visualize divergences and understand their implications for price movement.
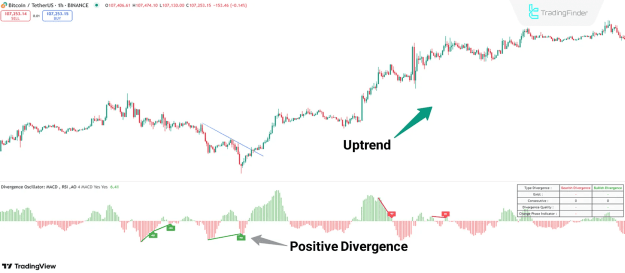
Positive Divergence in an Uptrend
A positive divergence is a strong signal for a potential bullish reversal. For example, on a Bitcoin chart, if the price forms lower highs (LH) while the oscillator (such as MACD) forms higher lows (HL), this indicates a positive divergence. Such a divergence suggests that bearish momentum is weakening and a price reversal to the upside may be imminent, creating a potential opportunity for buy trades.
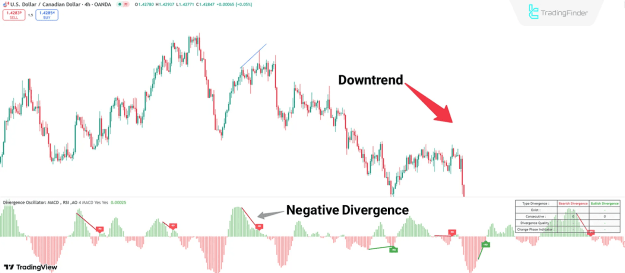
Negative Divergence in a Downtrend
Conversely, a negative divergence often signals the end of an uptrend and the beginning of a downtrend. Consider a USD/CAD chart where the price forms higher highs (HH), but the oscillator displays lower highs (LL). This indicates a negative divergence, suggesting that bullish momentum is fading. This setup presents a potential opportunity for sell trades as the price is likely to reverse and begin a new downtrend.
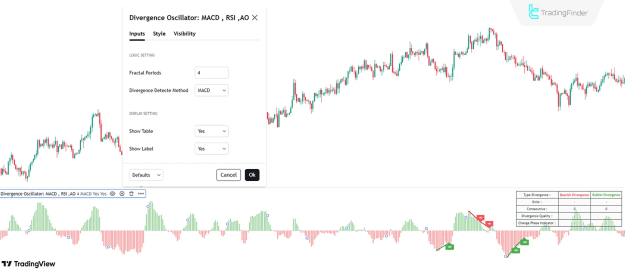
Indicator Customization
The Divergence Detector Indicator offers flexible settings to allow traders to tailor the tool to their specific needs.
- Fractal Periods: Adjust the fractal period to control the sensitivity of divergence detection. The default is typically set to 4.
- Detection Method: A crucial setting that allows you to choose which oscillator you want to use for divergence detection: MACD, RSI, or AO.
- Display Options: You can toggle the display of the Divergence Table and Labels on the chart to maintain a clean and customized trading view.
Conclusion
The Divergence Detector MACD + RSI + AO Oscillator is an essential analytical tool that empowers traders to identify key market turning points. By integrating three popular oscillators, it provides a robust method for spotting positive and negative divergences. The visual representation on the chart, combined with the detailed information in the divergence table, enables traders to validate signals and make more informed decisions, whether they are engaging in intraday or swing trading.