You can access the Indicator from this link:
https://tradingfinder.com/products/i...to-vwap-bands/
You can access the Indicator on the TradingView website:
https://www.tradingview.com/script/d...-Forex-Crypto/
Prop Firm DrawDown Protector : Prop Firm Capital Protection Expert MT4 | Forex Money Management: Forex Trade Management Expert MT4 |ICT Concepts Indicator MT4 | Smart Money Concepts Expert MT4| Smart Money Trap Scanner | Get a free Expert Advisor license via Telegram and WhatsApp
What are the VWAP Bands?
The VWAP Bands are a versatile TradingView indicator that helps identify support and resistance levels. At its core, the indicator's midline represents the VWAP line, which is the average price weighted by the volume traded. The bands extending above and below this line act as dynamic boundaries, highlighting where the price is moving relative to the volume-weighted average.
VWAP Bands Indicator Specifications
This advanced tool is categorized as a reversal, lagging, and breakout indicator. It is particularly well-suited for day trading and works effectively across a variety of financial instruments:
- Forex
- Cryptocurrency
- Stocks
The VWAP Bands indicator is a multi-timeframe tool, making it adaptable to different trading strategies and time horizons.
Interpreting VWAP Bands for Market Analysis
The VWAP Bands offer clear visual cues for interpreting market direction and identifying potential trading opportunities.
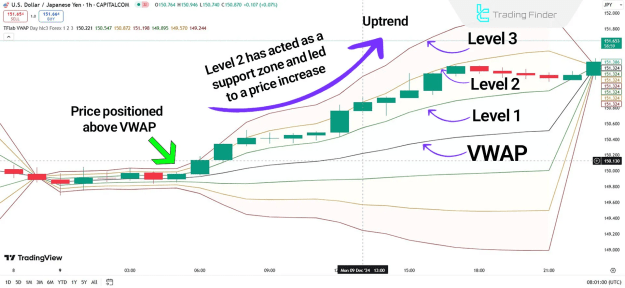
VWAP Bands in an Uptrend
When the price consistently trades above the VWAP line, it indicates a strong uptrend or a positive market sentiment. In an uptrend, the lower bands of the VWAP can act as crucial dynamic support zones. This condition is often interpreted by traders as a buy signal, as illustrated in the price chart of the USD/JPY currency pair.
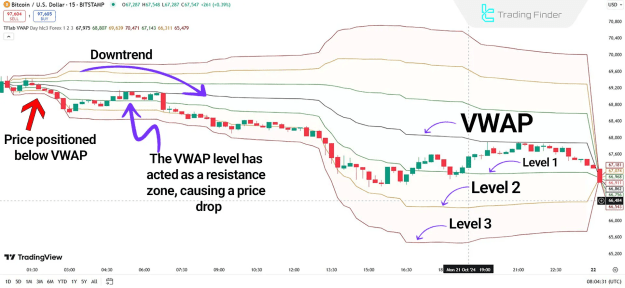
VWAP Bands in a Downtrend
Conversely, when the price falls and remains below the VWAP line, it signals a downtrend and a strong selling pressure in the market. In such cases, the upper VWAP bands can serve as significant dynamic resistance zones. This situation is typically recognized as a sell signal, as shown in the Bitcoin (BTC) 15-minute price chart.
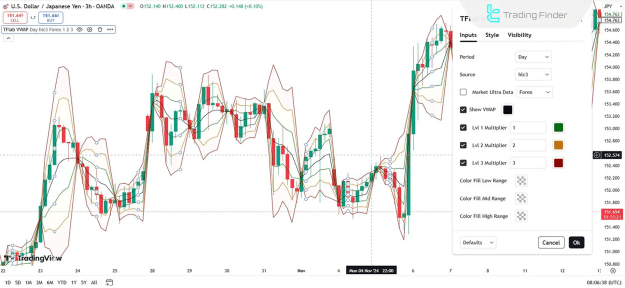
Customizing Your VWAP Bands Indicator
The VWAP Bands indicator offers a range of settings to customize its appearance and calculation to fit your specific trading needs.
- VWAP Calculation: You can adjust the Period and Source of the data used for the VWAP calculation.
- Band Multipliers: The indicator allows for the customization of three distinct levels of bands using Lvl 1 Multiplier, Lvl 2 Multiplier, and Lvl 3 Multiplier.
- Visual Settings: You can easily change the visual aspects of the indicator, including enabling or disabling the Show VWAP line and selecting Color Fill options for the Low Range, Mid Range, and High Range to enhance chart clarity.
Conclusion: A Powerful Tool for Volume-Based Trading
The VWAP Bands indicator is a powerful analytical tool for traders, providing valuable insights into market trends by integrating both price and volume data. This indicator is highly effective for markets where volume plays a significant role in price movements, such as Forex and Cryptocurrency markets, helping traders identify opportune moments for entry and exit points.