This indicator helps traders easily identify trend reversals and false breakouts by combining three crucial elements:
- Change of Character (CHoCH): Signals a shift in trend direction.
- Break of Structure (BOS): Confirms the continuation of a trend.
- Liquidity Sweeps: Identifies price movements that target liquidity zones.
You can access the Indicator from this link:
https://tradingfinder.com/products/i...e-inducements/
You can access the Indicator on the TradingView website:
https://www.tradingview.com/script/w...ch-BOS-Sweeps/
Prop Firm DrawDown Protector : Prop Firm Capital Protection Expert MT5 |Forex Money Management: Forex Trade Management Expert MT5 | ICT Concepts Indicator MT5 |Smart Money Concepts Expert MT5 | Smart Money Trap Scanner |Get a free Expert Advisor license via Telegram and WhatsApp
Indicator Specifications and Overview
This advanced indicator is designed for a variety of trading instruments and timeframes, making it a versatile tool for skilled traders.
- Indicator Categories: This tool is categorized under ICT TradingView Indicators, Smart Money TradingView Indicators, and Liquidity TradingView Indicators.
- Platform: It is available exclusively on TradingView.
- Trading Skills: Recommended for traders with advanced trading skills.
- Indicator Types: Functions as a reversal trading indicator.
- Timeframe: It is a multi-timeframe trading indicator.
- Trading Style: Best suited for Intraday trading.
- Trading Instruments: It can be applied across various markets, including Forex, Cryptocurrency, Stocks, Commodities, and Indices.
The indicator's core function is to identify CHoCH, BOS, and Liquidity Sweeps. The Change of Character signals a potential shift from a bullish to a bearish trend or vice versa. The Break of Structure confirms the breach of significant support or resistance levels. Liquidity Sweeps highlight price movements that aim to trigger stop-losses or pending orders in specific liquidity zones.
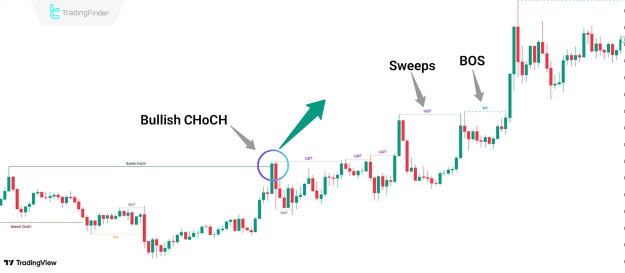
Market Structure Performance in a Bullish Trend
Analysis of the Cardano (ADA) 15-minute price chart demonstrates the indicator's effectiveness during an uptrend. After a CHoCH signals a potential reversal, the price continues its upward movement, even after several Liquidity Sweeps. The indicator uses blue dashed lines to mark a BOS, confirming the continuation and strength of the bullish trend.
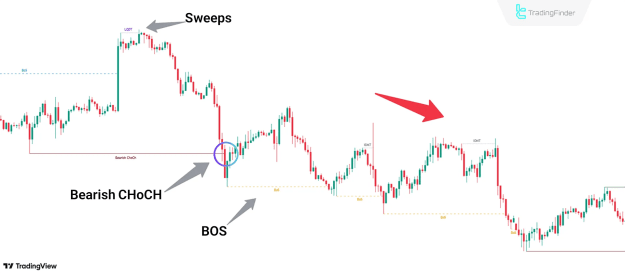
Market Structure Performance in a Bearish Trend
The 1-hour chart for the USD/JPY currency pair illustrates the indicator's performance in a downtrend. Following a Liquidity Sweep, the market transitions into a downtrend. This shift is confirmed by a CHoCH, signaling a change from a bullish to a bearish market. Subsequent BOS formations further highlight the strength and continuation of this bearish trend.
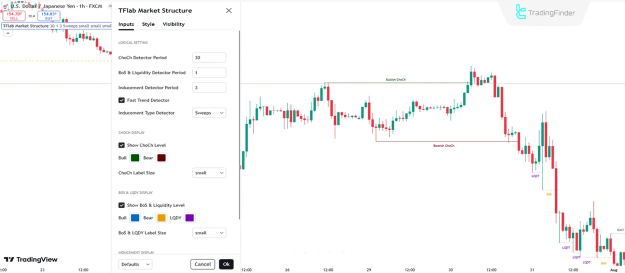
Reviewing Market Structure Inducements Indicator Settings
The indicator offers several customizable settings, allowing traders to fine-tune its performance to their specific strategies.
- ChoCh Detector Period: Specifies the period for detecting a Change of Character.
- BoS & Liquidity Detector Period: Sets the detection period for BOS and Liquidity Levels.
- Inducement Detector Period: Determines the period for identifying inducement zones.
- Fast Trend Detector: A feature that automatically identifies rapid market trends.
- Inducement Type Detector: Allows definition of inducement zone types.
- Show ChoCh Level: A toggle to display CHoCH levels on the chart.
- Bull / Bear Colors: Customizes the colors for bullish and bearish CHoCH zones.
- ChoCh Label Size: Adjusts the size of the CHoCH labels.
- Show BoS & Liquidity Level: Enables the display of BOS and Liquidity Levels.
- Bull / Bear / LQDY Colors: Configures the colors for BOS and Liquidity Levels.
- BoS & LQDY Label Size: Adjusts the label sizes for BOS and Liquidity Levels.
- Show Inducement Level: A toggle to display inducement levels.
- Inducement Label Size: Sets the size of the inducement labels.
Conclusion
The Market Structure Inducements Indicator is a powerful and advanced tool for market analysis based on the ICT trading style. By visually representing Change of Character, Break of Structure, and Liquidity Sweeps, this TradingView ICT indicator provides traders with a clearer understanding of market dynamics. This, in turn, enhances the accuracy of future price movement predictions and simplifies the identification of potential trading opportunities.