You can access the Indicator from this link:
https://tradingfinder.com/products/i...ume-delta-ema/
You can access the Indicator on the TradingView website:
https://www.tradingview.com/script/G...-Periodic-EMA/
Prop Firm DrawDown Protector : Prop Firm Capital Protection Expert MT4 | Forex Money Management: Forex Trade Management Expert MT4 |ICT Concepts Indicator MT4 | Smart Money Concepts Expert MT4| Smart Money Trap Scanner | Get a free Expert Advisor license via Telegram and WhatsApp
Key Features and Specifications
The CVD indicator is a versatile tool that falls under several categories, making it useful for different trading strategies:
- Categories: Oscillators, Volatility, and Currency Strength Indicators
- Platforms: TradingView
- Trading Skills: Intermediate
- Types: Reversal Indicators
- Timeframe: Multi-Timeframe
- Trading Style: Intraday
- Instruments: Forex, Cryptocurrency, and Stocks
The CVD's primary function is to help traders identify divergences, which are key to spotting potential trend reversals. When the CVD's movement does not align with the price action, it can signal a shift in market momentum. This makes the indicator highly effective for pinpointing optimal Entry and Exit points.
Identifying Bullish and Bearish Trend Conditions
The CVD indicator is particularly useful for spotting divergences that signal a change in trend direction.
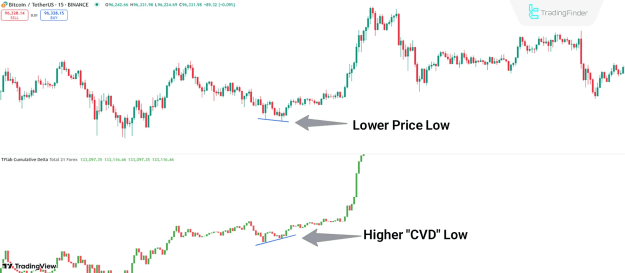
Bullish Trend Conditions
A bullish divergence occurs when the price of an asset, such as Bitcoin (BTC) on a 15-minute chart, forms a lower low, but the CVD indicator simultaneously forms a higher low. This discrepancy suggests that despite the price's decline, selling pressure is weakening and buying pressure is secretly building. The upward movement of the CVD, combined with this divergence, can indicate a potential opportunity to enter a buy trade.
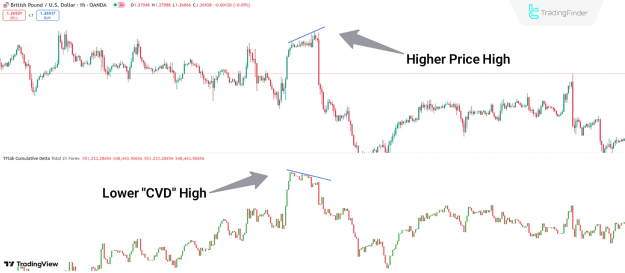
Bearish Trend Conditions
Conversely, a bearish divergence is observed when the price, for example, on the GBP/USD 1-hour chart, forms a higher high, but the CVD indicator forms a lower high. This divergence highlights a lack of conviction from buyers, even as the price rises. The downward movement of the CVD in this scenario can signal that the uptrend is losing momentum and a potential opportunity to enter a sell trade is emerging.
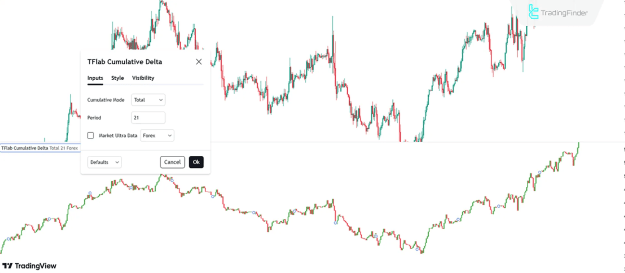
Indicator Settings
To fine-tune the CVD indicator for specific trading needs, users can adjust its settings:
- Cumulative Mode: This setting dictates how the data is calculated, typically in an aggressive, cumulative fashion.
- Period: This value determines the number of periods used for the indicator's calculation (e.g., set to 21).
- Market Ultra Data: This option allows traders to specify the market type used for the calculations, ensuring more accurate and relevant data.
Conclusion
The Cumulative Volume Delta (CVD) is a highly effective tool for analyzing market pressure and detecting divergence across various markets, including crypto, forex, and stocks. By paying close attention to the indicator's direction and the presence of divergences, traders can make more informed decisions regarding trend reversals and overall market sentiment.