You can access the Indicator from this link:
https://tradingfinder.com/products/i...lta-histogram/
You can access the Indicator on the TradingView website:
https://www.tradingview.com/script/6...CVD-Histogram/
Prop Firm DrawDown Protector : Prop Firm Capital Protection Expert MT4 | Forex Money Management: Forex Trade Management Expert MT4 |ICT Concepts Indicator MT4 | Smart Money Concepts Expert MT4| Smart Money Trap Scanner | Get a free Expert Advisor license via Telegram and WhatsApp
How the CVD Histogram Indicator Works
The CVD Histogram appears as a bar chart in a separate window below the main price chart. It operates cumulatively, meaning it calculates the difference between buy and sell volumes for each candlestick and then adds this value to the total of the previous candlestick. This process creates a continuous, running total of market aggression.
- Green bars on the histogram indicate that buy volume is currently dominating sell volume. Taller green bars signify a stronger buying force in the market.
- Red bars show the opposite: sell volume is surpassing buy volume. Taller red bars reflect increasing selling pressure and greater seller strength.
This cumulative function allows traders to see how market momentum is building or fading over time, not just on a bar-by-bar basis.
Using the CVD Histogram in Bullish and Bearish Trends
The CVD Histogram is especially effective for identifying trend reversals and confirming the strength of a trend.
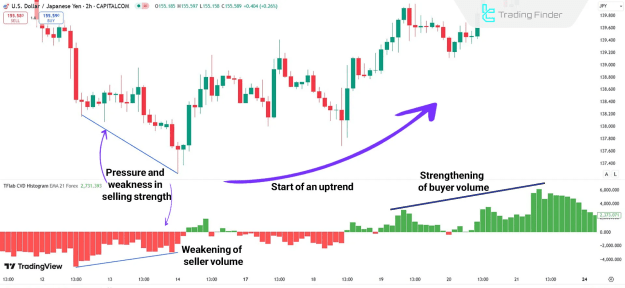
CVD in Bullish Trends
When a price chart, such as the USD/JPY on a 2-hour timeframe, shows a decline in the height of the red bars on the CVD Histogram, it signals a weakening of seller strength. This loss of dominance by sellers allows buyers to gradually take control of the market. The decreasing red bars indicate that the downward momentum is fading, which can be a precursor to an upward trend. As buyers gain strength, they push the price higher, initiating a new bullish movement.
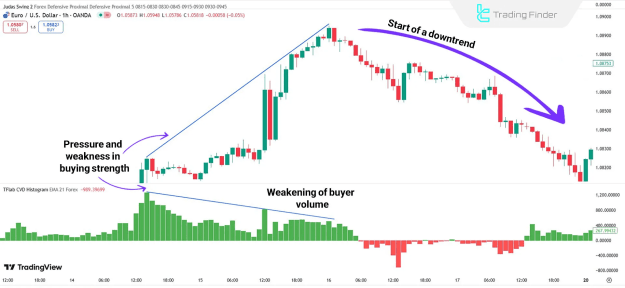
CVD in Bearish Trends
Conversely, on a chart like the EUR/USD on a 1-hour timeframe, a gradual decrease in the height of the green bars on the CVD Histogram signals a weakening of buyer strength. This reduction in buy pressure means that buyers are losing their dominance. As the bullish momentum subsides, sellers begin to take control, halting the upward trend and initiating a new downward movement. The shrinking green bars serve as an early warning of a potential trend reversal to the downside.
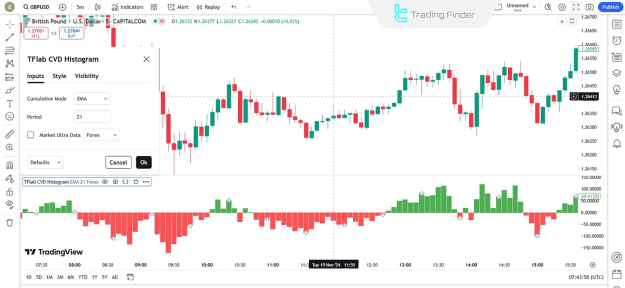
Indicator Settings
The following are the primary settings for the Cumulative Volume Delta Histogram, which allow traders to customize the tool for their specific strategies:
- Cumulative Mode: This setting controls how the data is displayed, presenting it as a running total.
- Period: This parameter determines the number of bars used to calculate the indicator’s data, influencing the sensitivity of the histogram.
- Market Ultra Data: This advanced option provides access to more detailed and precise market data for a more refined analysis.
Conclusion
The Cumulative Volume Delta Histogram is a valuable tool for traders seeking to understand the underlying mechanics of price movements. By providing a clear and cumulative view of buy and sell pressure, this indicator helps to identify trend reversal points and assess the strengths and weaknesses of market participants. This enhanced volume analysis can lead to more informed trading decisions and a better understanding of market sentiment.