You can access the Indicator from this link:
https://www.metalsmine.com/forum/158...ent/new-thread
You can access the Indicator on the TradingView website:
https://www.tradingview.com/script/F...ern-indicator/
Prop Firm DrawDown Protector : Prop Firm Capital Protection Expert MT5 |Forex Money Management: Forex Trade Management Expert MT5 | ICT Concepts Indicator MT5 |Smart Money Concepts Expert MT5 | Smart Money Trap Scanner |Get a free Expert Advisor license via Telegram and WhatsApp
Key Features and Functionality
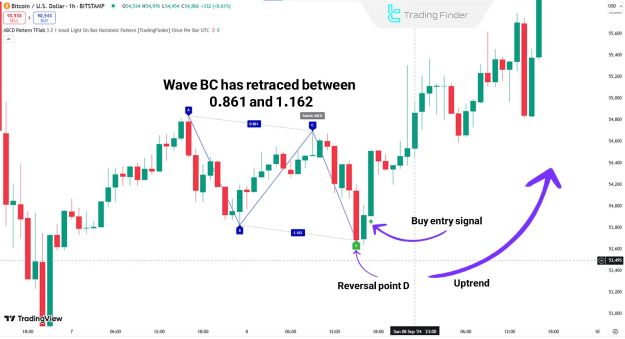
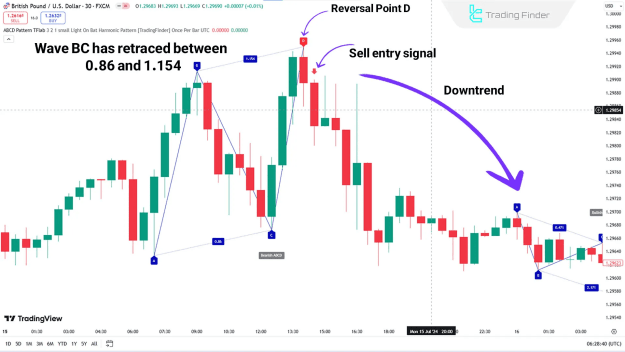
The core of the ABCD pattern is its reliance on specific Fibonacci ratios to accurately pinpoint Potential Reversal Zones (PRZ). The indicator displays a green arrow for bullish signals and a red arrow for bearish (sell) signals, making it easy for traders to spot potential entry points.
Pattern Structure and Fibonacci Ratios
- Wave BC Correction: The corrective wave BC typically retraces a specific percentage of the initial wave AB. According to the pattern's rules, this retracement usually falls within the range of 0.382 to 0.886 of wave AB.
- Wave CD Extension: The final wave, CD, extends from point C to point D. This extension is defined by Fibonacci ratios of wave BC, specifically ranging from 1.13 to 2.618. Point D marks the conclusion of the pattern and is identified as the PRZ, where a price reversal is likely to occur.
Bullish and Bearish Patterns
- Bullish Pattern (Uptrend): In an uptrend, the indicator first identifies a bearish wave AB, followed by a corrective bullish wave BC. This is followed by a final bearish wave CD, which leads to point D. Once point D is identified as the PRZ, the indicator issues a Buy entry signal.
- Bearish Pattern (Downtrend): In a downtrend, a bullish wave AB is formed, followed by a corrective bearish wave BC. A subsequent bullish wave CD then reaches point D. At this point, which is the PRZ, the indicator issues a Sell entry signal.
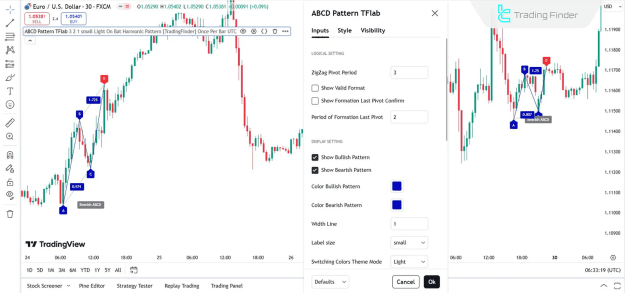
Indicator Settings and Customization
The ABCD Harmonic Pattern indicator offers a variety of settings that allow traders to customize its appearance and functionality to suit their preferences.
- ZigZag Pivot Period: This setting determines the period used for calculating the ZigZag pivots, with a default value of 3.
- Pattern Display: Traders can choose to display only valid patterns, show confirmation of the last pivot, and specify the period for this confirmation.
- Pattern Colors: Users can set custom colors for both bullish (default blue) and bearish (default red) patterns.
- Visual Elements: The indicator allows for customization of line thickness and label size to improve chart visualization.
- Alerts: Traders can configure alerts to receive notifications whenever a new pattern is formed, including custom alert names and message frequencies.
Conclusion
The ABCD Harmonic Pattern Indicator on TradingView is an essential tool for traders who utilize harmonic patterns in their analysis. By automatically detecting these patterns and identifying Potential Reversal Zones (PRZ) with high accuracy based on Fibonacci ratios, it provides valuable insights for making informed trading decisions. Its robust customization options for colors, line thickness, and alerts make it a versatile tool for analyzing potential reversal points across various markets, including Forex, cryptocurrencies, and stocks.