On TradingView, the 5-0 Harmonic Pattern consists of five critical points (X-A-B-C-D), each connected by specific Fibonacci retracements and extensions. This pattern is particularly effective in spotting reversal signals after strong trending moves.
You can access the Indicator from this link:
https://tradingfinder.com/products/i...monic-pattern/
You can access the Indicator on the TradingView website:
https://www.tradingview.com/script/9...onic-Detector/
Prop Firm DrawDown Protector : Prop Firm Capital Protection Expert MT5 |Forex Money Management: Forex Trade Management Expert MT5 | ICT Concepts Indicator MT5 |Smart Money Concepts Expert MT5 | Smart Money Trap Scanner |Get a free Expert Advisor license via Telegram and WhatsApp
Key Features of the 5-0 Harmonic Pattern Indicator
Indicator Categories
- Harmonic TradingView Indicators
- Candlestick TradingView Indicators
- Chart & Classic TradingView Indicators
Compatibility & Trading Applications
- Platform: TradingView
- Skill Level: Intermediate
- Indicator Type: Reversal Signals
- Timeframe: Multi-Timeframe Analysis
- Trading Style: Intraday & Swing Trading
- Markets: Forex, Cryptocurrencies, Commodities, Stocks
How the 5-0 Harmonic Pattern Works
Pattern Structure
- X to A – The initial price movement (impulse wave).
- A to B – A corrective retracement against the trend.
- B to C – A secondary move in the original trend direction.
- C to D – The final leg, completing the harmonic formation.
Once the pattern confirms, the indicator marks entry signals with arrows, helping traders capitalize on potential reversals.
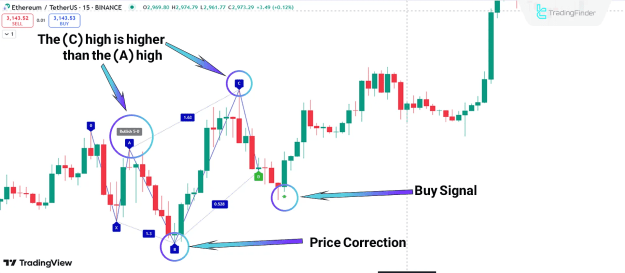
Bullish 5-0 Harmonic Pattern (Buy Signal)
A bullish 5-0 pattern forms after a downtrend, signaling a potential upward reversal.
Example on Ethereum (ETH) – 15-Minute Chart
- X to A: Initial upward move.
- A to B: Corrective pullback.
- B to C: New higher high (above point A).
- C to D: Completion of the pattern.
The indicator plots a green arrow at point D, suggesting a buy entry.
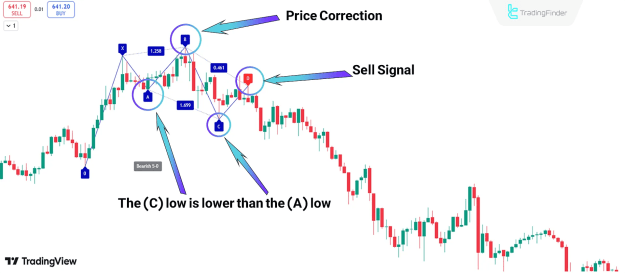
Bearish 5-0 Harmonic Pattern (Sell Signal)
A bearish 5-0 pattern appears after an uptrend, indicating a possible downward reversal.
Example on Binance Coin (BNB) – 1-Hour Chart
- X to A: Initial downward move.
- A to B: Corrective retracement upward.
- B to C: New lower low (below point A).
- C to D: Pattern completion.
The indicator marks a red arrow at point D, signaling a sell entry.
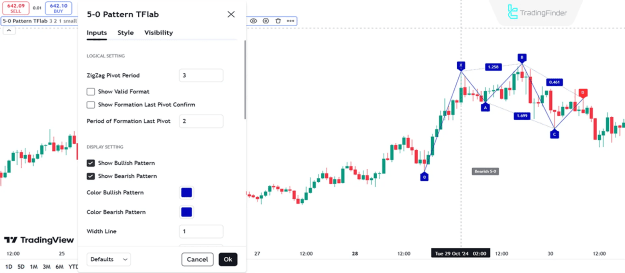
Optimal Indicator Settings for TradingView
Configuration Parameters
- ZigZag Pivot Period: 3 (for calculating swing highs/lows).
- Show Valid Pattern: Enabled (displays only confirmed formations).
- Show Formation Last Pivot Confirm: Activates final pivot confirmation.
- Period of Formation Last Pivot: 1 (for precise validation).
- Show Bullish/Bearish Patterns: Toggle based on trading strategy.
- Color Customization: Adjust colors for better visibility.
- Line Width: 1 (for clean chart presentation).
- Label Size: Customizable for readability.
- Theme Mode: Light/Dark for user preference.
- Alerts: Set notifications for pattern confirmations.
Conclusion
The 5-0 Harmonic Pattern Indicator is an essential tool for traders seeking high-probability reversal setups. By combining automated pattern detection with Fibonacci principles, it improves decision-making in forex, crypto, and stock markets.
For optimal results, traders should:
![]() Confirm signals with additional technical analysis.
Confirm signals with additional technical analysis.
![]() Apply strict risk management strategies.
Apply strict risk management strategies.
![]() Use multi-timeframe analysis for stronger confluence.
Use multi-timeframe analysis for stronger confluence.
Integrating this indicator into a trading plan can significantly enhance entry precision and market timing.