- A positive delta reflects greater buying volume than selling.
- A negative delta reflects greater selling volume than buying.
An uptrend is signaled when the CVD value increases with a positive slope, while a downtrend is signaled when the value decreases with a negative slope. Divergences between price and CVD can also provide early signals for potential trend reversals.
You can access the Indicator from this link:
https://tradingfinder.com/products/i...-volume-delta/
You can access the Indicator on the TradingView website:
https://tradingfinder.com/products/i...s/tradingview/
Prop Firm DrawDown Protector : Prop Firm Capital Protection Expert MT4 | Forex Money Management: Forex Trade Management Expert MT4 |ICT Concepts Indicator MT4 | Smart Money Concepts Expert MT4| Smart Money Trap Scanner | Get a free Expert Advisor license via Telegram and WhatsApp
Overview
The CVD Indicator is an essential tool for traders aligning their positions with the market’s main trend. Divergence between the CVD and the price chart can be a strong indication of potential reversals.
This trading tool:
- Calculates ongoing buy and sell volume
- Estimates the volume change in the prevailing trend
- Predicts future price movement
Uptrend Conditions
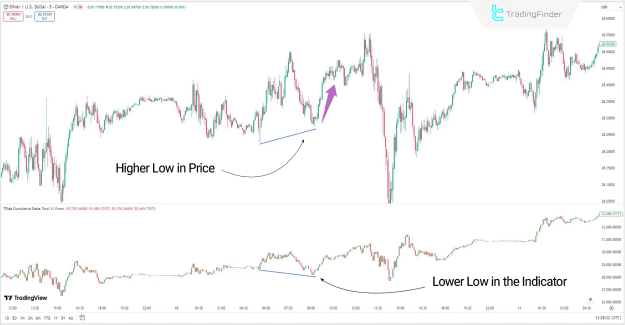
In the example of a 5-minute silver price chart, the price forms a higher low compared to the previous low, while the CVD forms a lower low than its previous low.
This scenario creates a Bullish Divergence between price and the Cumulative Volume Delta, signaling a potential shift toward an uptrend.
Downtrend Conditions
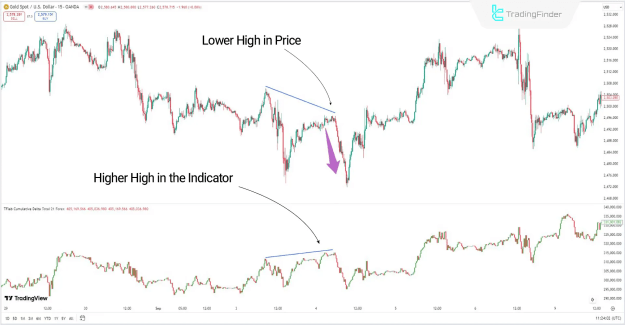
In the example of a 15-minute gold price chart, the price forms a lower high compared to the previous high, while the CVD forms a higher high than its previous high.
This condition results in a Bearish Divergence between price and the Cumulative Volume Delta, indicating a potential move back into a downtrend.
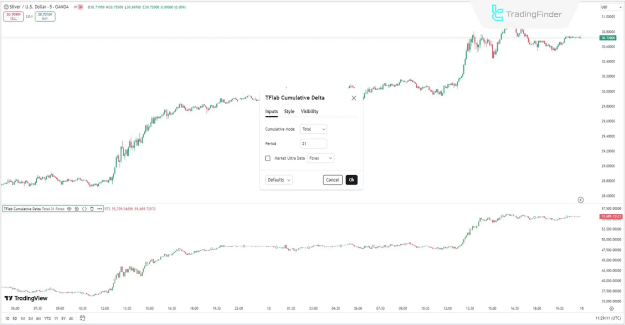
Indicator Settings
- Cumulative Mode:
Three modes are available. The default is Total, which accumulates volume from the start to the end of the session. - Period:
Default value is 21. - Periodic Mode:
Accumulates volume periodically. - EMA Mode:
Calculates the Exponential Moving Average of the volume.
Summary
The CVD Indicator in TradingView is a powerful technical analysis tool for assessing market volatility and trend direction. By aggregating the volume delta for each candlestick, it calculates buying and selling pressure to forecast potential market moves.
- Upward movement with positive slope: Indicates strong buying pressure.
- Downward movement with negative slope: Indicates strong selling pressure.
This indicator is particularly effective in highly volatile markets, providing traders with valuable insight into momentum and potential reversals.