Prop Firm DrawDown Protector : Prop Firm Capital Protection Expert MT4 |Forex Money Management: Forex Trade Management Expert MT4 |ICT Concepts Indicator MT4 | Smart Money Concepts Expert MT4| Get a free Expert Advisor license via Telegram and WhatsApp
Why Combine Fibonacci Retracement with Candlestick Patterns?
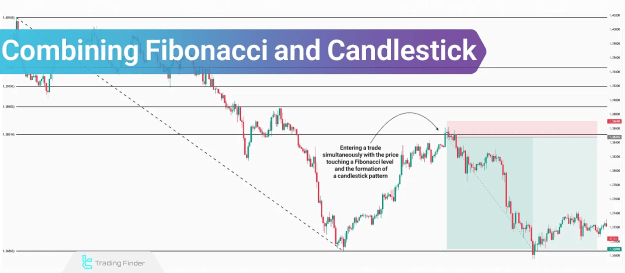
While Fibonacci retracement levels identify potential reversal zones, they do not provide exact entry signals. Price may often sweep beyond these levels before reversing, leading to premature entries. Candlestick patterns, however, offer precise signals within these zones, improving timing and risk management.
Key Benefits of This Combination:
- Accurate Entry Points: Candlestick patterns refine entries within Fibonacci zones.
- Improved Stop-Loss Placement: Traders can set stops beyond recent swing points or pattern extremes.
- Higher Probability Reversals: Confirmation from both Fibonacci and candlestick patterns increases trade validity.
Best Candlestick Patterns to Use with Fibonacci
Reversal candlestick patterns are the most effective when combined with Fibonacci retracements. These patterns work in both trending and counter-trend scenarios.
High-Probability Candlestick Patterns:
- Hammer Pattern
- Features a small body near the top and a long lower shadow.
- Signals potential bullish reversals in downtrends.
- Shooting Star Pattern
- Characterized by a small body near the bottom and a long upper shadow.
- Indicates potential bearish reversals in uptrends.
- Hanging Man Pattern
- Similar to the Hammer but appears in uptrends.
- Suggests a possible bearish reversal.
- Engulfing Pattern
- Consists of two candles; the second fully engulfs the first.
- Bullish Engulfing (downtrend reversal) and Bearish Engulfing (uptrend reversal).
Step-by-Step Trading Strategy Using Fibonacci and Candlestick Patterns
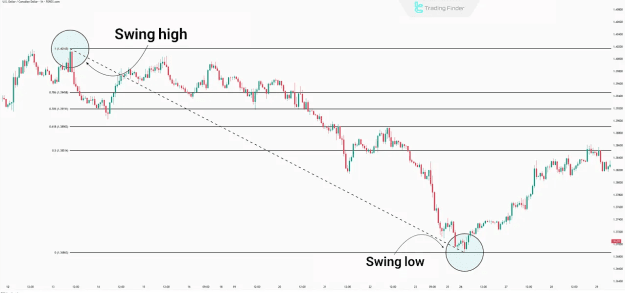
Step 1: Drawing Fibonacci Retracement Levels
- Identify a clear swing high and swing low in the trend.
- Apply the Fibonacci retracement tool between these points.
- Key levels to watch: 38.2%, 50%, 61.8%, and 78.6%.
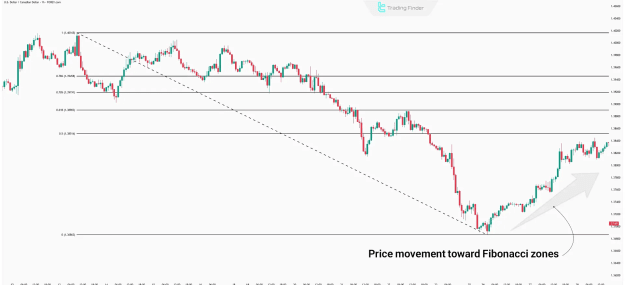
Step 2: Monitoring Price Reaction at Key Fibonacci Levels
- Wait for price to approach a significant Fibonacci level (preferably 50%, 61.8%, or 78.6%).
- Observe price behavior—consolidation or rejection—at these levels.
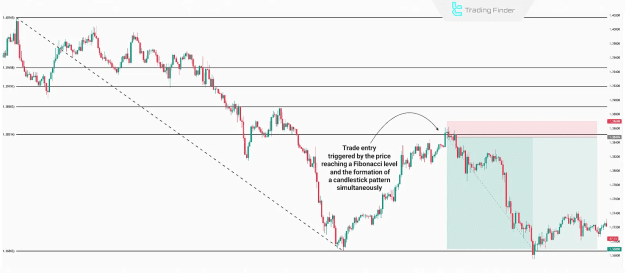
Step 3: Confirming Entry with Candlestick Patterns
- Look for a reversal candlestick pattern forming near the Fibonacci level.
- Enter the trade upon pattern confirmation (e.g., close beyond the Hammer’s high for a long position).
Example Trade Setup:
- Price retraces to the 50% Fibonacci level after an uptrend.
- A Shooting Star forms, signaling potential bearish reversal.
- Enter short after confirmation, with a stop-loss above the recent swing high.
Risk Management in Fibonacci-Candlestick Trading
Since Fibonacci levels act as zones rather than exact points, traders must account for false breakouts. Key risk management principles include:
- Position Sizing: Allocate capital wisely to withstand multiple retests.
- Stop-Loss Placement: Set stops beyond the Fibonacci zone or recent swing points.
- Avoid Overleveraging: Ensure sufficient margin for potential retracements to deeper levels (e.g., 61.8% after 50%).
Final Thoughts
Fibonacci retracement levels highlight potential reversal zones, but candlestick patterns provide the necessary confirmation for high-probability trades. By combining these tools, traders can achieve:
- Better Timing: Precise entries within key Fibonacci zones.
- Stronger Signals: Confluence between price action and retracement levels.
- Improved Risk-Reward Ratios: Strategic stop-loss and take-profit placement.
For optimal results, always validate Fibonacci levels with candlestick patterns and adhere to strict risk management protocols.